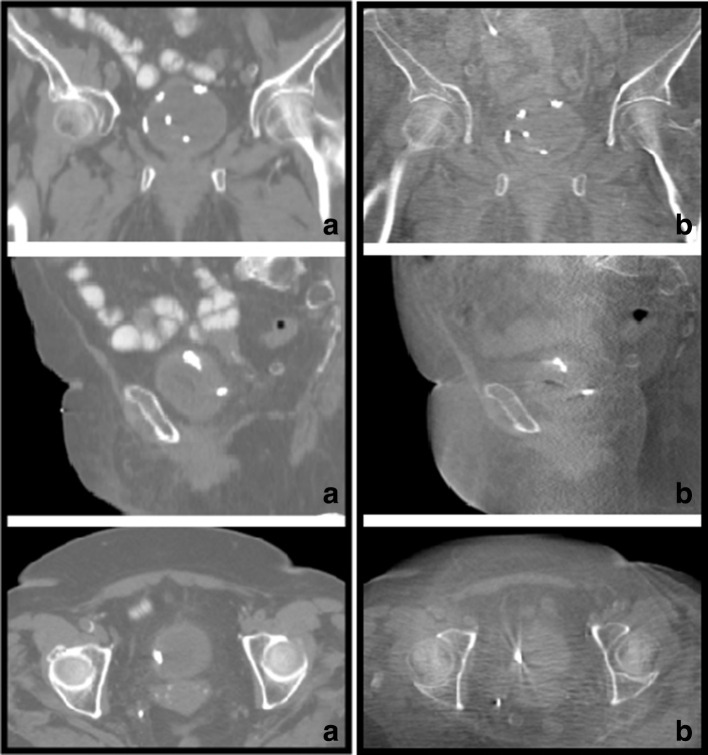
Figure 2.
Illustrative examples of BioXmark® spots in one patient on CT (A) and CBCT at end of treatment (B). Top images are in the coronal plane, middle images in the sagittal plane and the bottom images are in the axial plane. Note: the fifth, most central dot in the top images is not a BioXmark® dot, but a catheter.

