
Fig. 3.
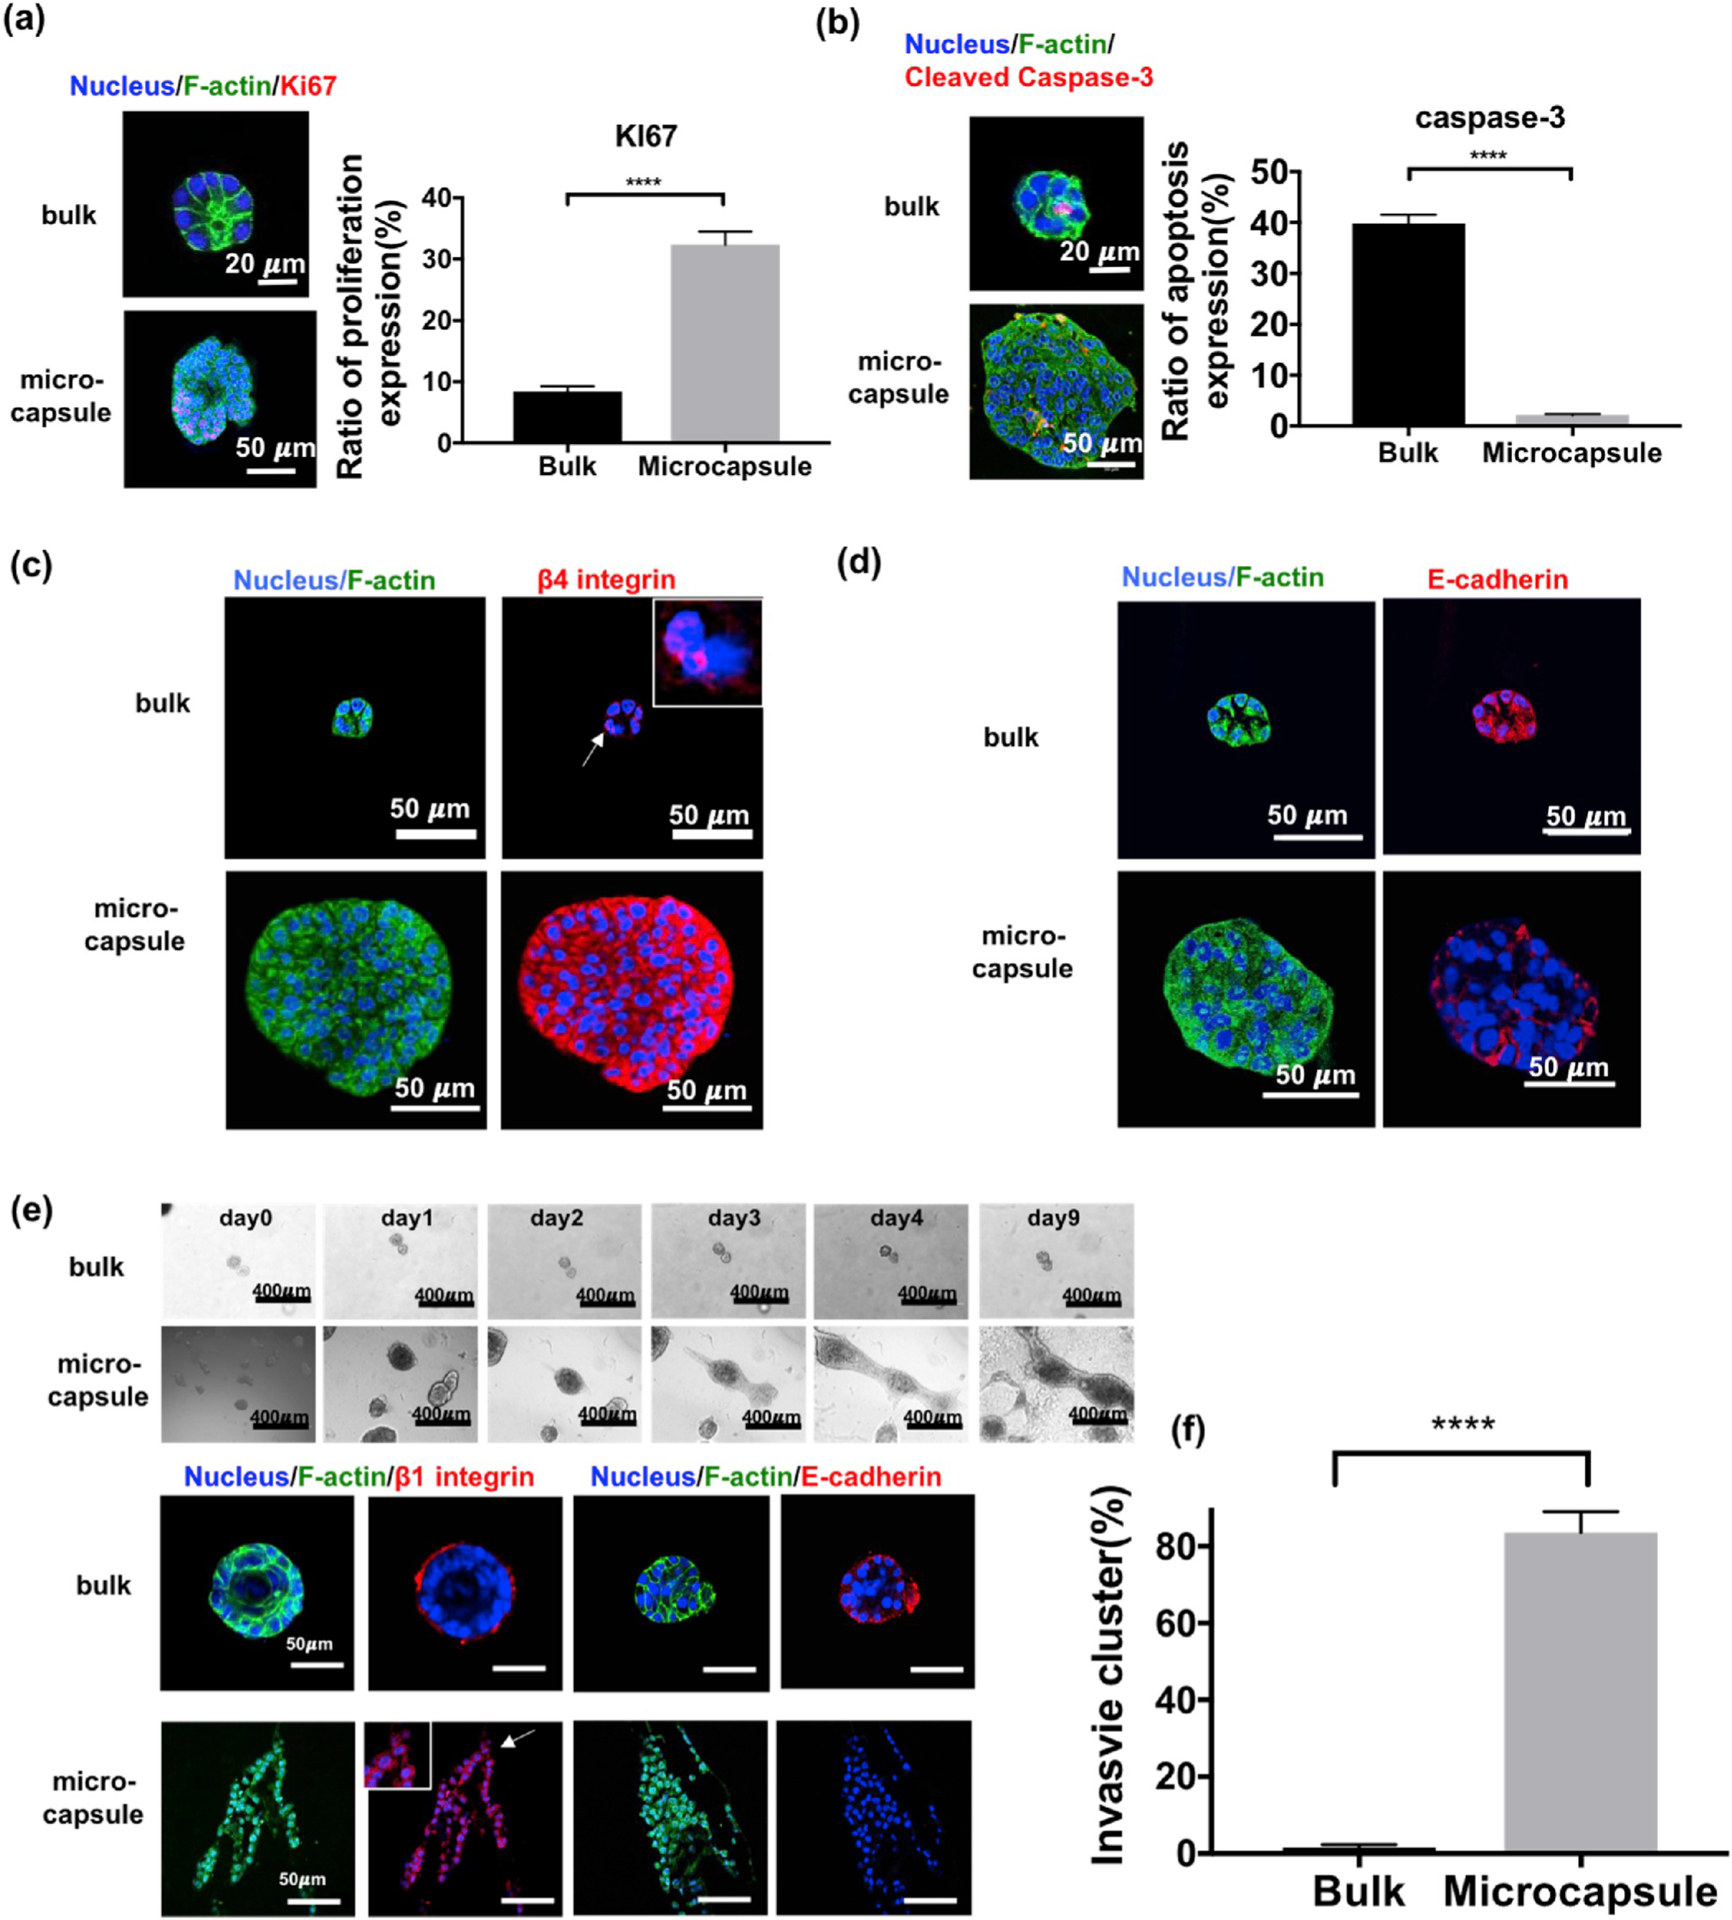
Characterization of the malignant behavior of confined MCF10A cells. (a) Expression of KI67 (red), a proliferation marker, in acini grown from bulk or aggregates from microcapsules. (n = 427 for bulk and 259 for microcapsules, pooled from 6 independent experiments, F = 62.68, df = 1, p < 0.0001 by two-way ANOVA) (b) Expression of cleaved caspase-3 (red), an apoptosis marker, in acini grown from bulk or aggregates from microcapsules. (n = 321 for bulk and 248 for microcapsules, pooled from 6 independent experiments, F = 151.2, df = 1, p < 0.0001) (c) Staining of F-actin (green) and integrin β4 (red) revealing the disruption of integrin localization in confined cells from microcapsules. (d) Staining of E-cadherin (red) which was fully expressed in bulk acini but mostly lost in cell aggregates from microcapsules, a suggestion of EMT. (e) An invasion assay: acini from bulk Matrigel maintained its structure after 9 days of culture in collagen, but the aggregates from microcapsules grew and started to invade into the surrounding collagen matrix after 2 days. (f) Quantification of the invasion assay (n = 130 for bulk and 116 for microcapsules, pooled from 3 independent experiments, t = 14.88, df = 4.181, p < 0.0001 by Welch-corrected t-test).