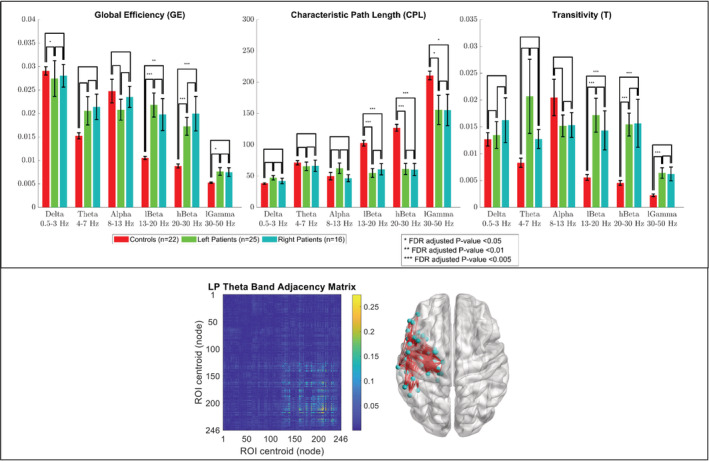
Figure 3.

Group comparison of the global efficiency (GE), characteristic path length (CPL), and transitivity (T) of the fourth quadrant (i.e., left intra‐hemispheric network) of the adjacency matrix in six frequency bands. Bar lengths indicate mean values; error bars indicate standard errors of the mean. p‐values were false discovery rate (FDR) adjusted for six frequency bands, three global graph measures, and two quadrants. (Bottom insert) Adjacency matrix of a representative left patient in the theta band, and a corresponding anatomical depiction showing connections with values above 0.1
