FIGURE 2.

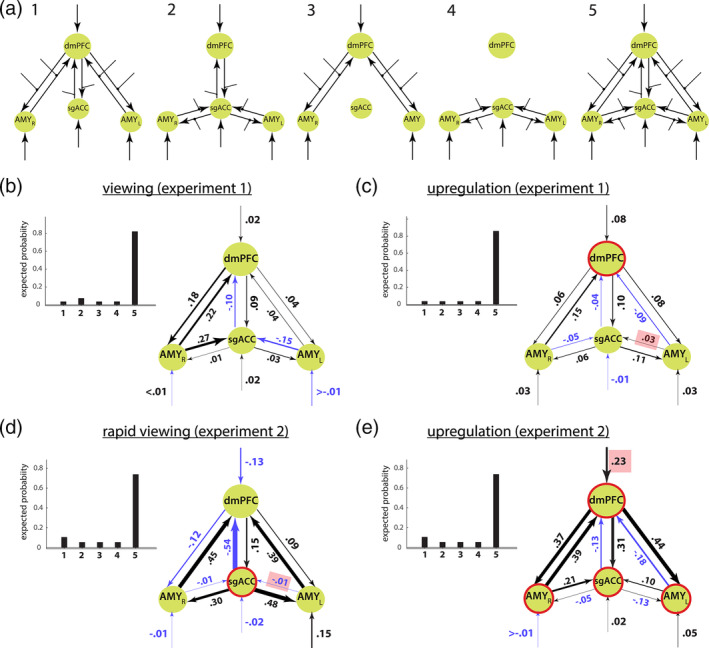
Estimation of general network structures. (a) All models consisted of four ROIs, reciprocal connections between the ROIs (arrows between nodes), modulatory inputs (lines with dotted end points), and external inputs into the ROIs (arrows). For family‐level inference, the model space was partitioned into five subsets with different connectivity patterns between the bilateral amygdala, the dmPFC, and the sgACC. For the first experiment, expected and exceedance family probabilities revealed that the fully connected model dominated during positive‐social (b) passive viewing and (c) emotion upregulation (6 s stimuli display duration) conditions. For the second experiment, expected and exceedance family probabilities showed the same dominance of the fully connected model family during positive‐social (d) rapid passive viewing (0.5 s stimuli display duration) and (e) emotion upregulation (4 s stimuli display duration) conditions. (b–e) Blue arrows highlight negative values. (c–e) Red circles around network nodes highlight corresponding experiment and condition brain areas that showed a significant correlation with psychometric scores, as well as red rectangles highlight the connectivity parameters that showed a significant correlation with psychometric scores (Figure 3). For simplicity, the reciprocal connections (matrix A in DCM) and the modulatory inputs (matrix B in DCM) between the ROIs are added and depicted as arrows between the ROIs. The BMA parameters are indicated next to the corresponding connections and illustrated by the proportional arrow thickness. The external input can reflect either the image presentation, the task, or both, being inherently linked to one another in our experimental designs. AMY, amygdala; dmPFC, dorsomedial prefrontal cortex; sgACC, subgenual anterior cingulate cortex; L, left; R, right
