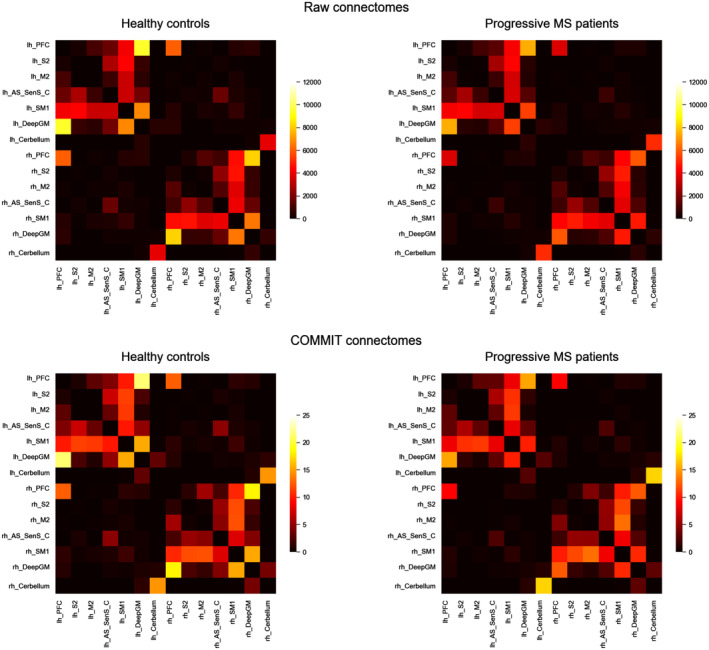
Figure 2.

Matrix representation of the connectomes obtained with the two different methods: counting the number of streamlines connecting two pairs of grey matter regions (top); or assigning the quantitative measures obtained with COMMIT (bottom). For both method we report the average connectomes obtained for the two groups of subjects: healthy controls (left) and PMS patients (right). In both cases (raw and COMMIT), the pattern of connections is similar, but while in the upper case the information contained in the connectomes is nonquantitative, in the bottom ones it represents the intra‐axonal signal fraction associated to each connection. We also observe that some interhemispheric connections present in the raw connectomes disappear after the application of COMMIT. COMMIT, convex optimization modelling for microstructure informed tractography; PMS, progressive multiple sclerosis
