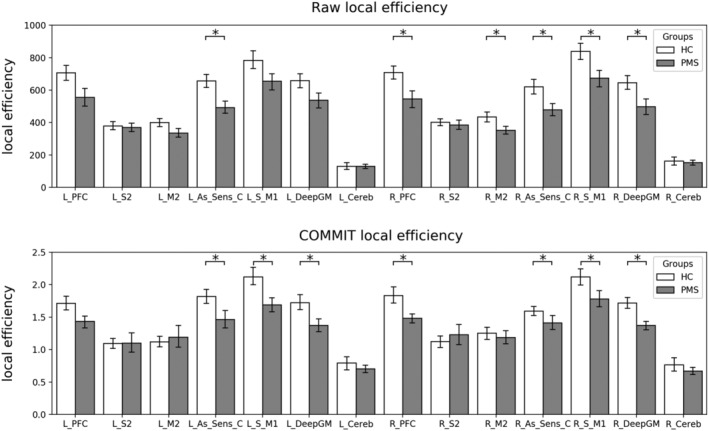
Figure 4.

Barplot showing the local efficiency of all the hubs of the motor network for both raw and COMMIT connectomes. The statistically significant differences between HCs in white and PMS patients in grey and accounting for discrepancies in age, sex and density are marked with an asterisk. COMMIT, convex optimization modelling for microstructure informed tractography; HCs, healthy controls; PMS, progressive multiple sclerosis
