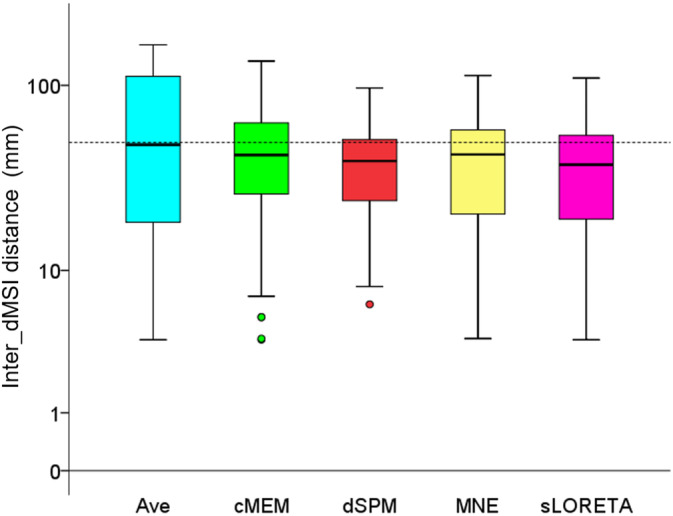
Figure 2.

Inter_dMSI distance. This measure provides an estimate of the spatial concordance between one method and all others and is expressed in mm. Inter_dMSI distance was significantly different across inverse methods, but the median value was consistently around 5 cm. This analysis confirms that there is a remarkable variability in the position of the map maximum across inverse solution techniques and supports the attempt to combine inverse methods to achieve a common map owning higher accuracy. Boxplots depict median and quartiles. The dash line is set to 5 cm
