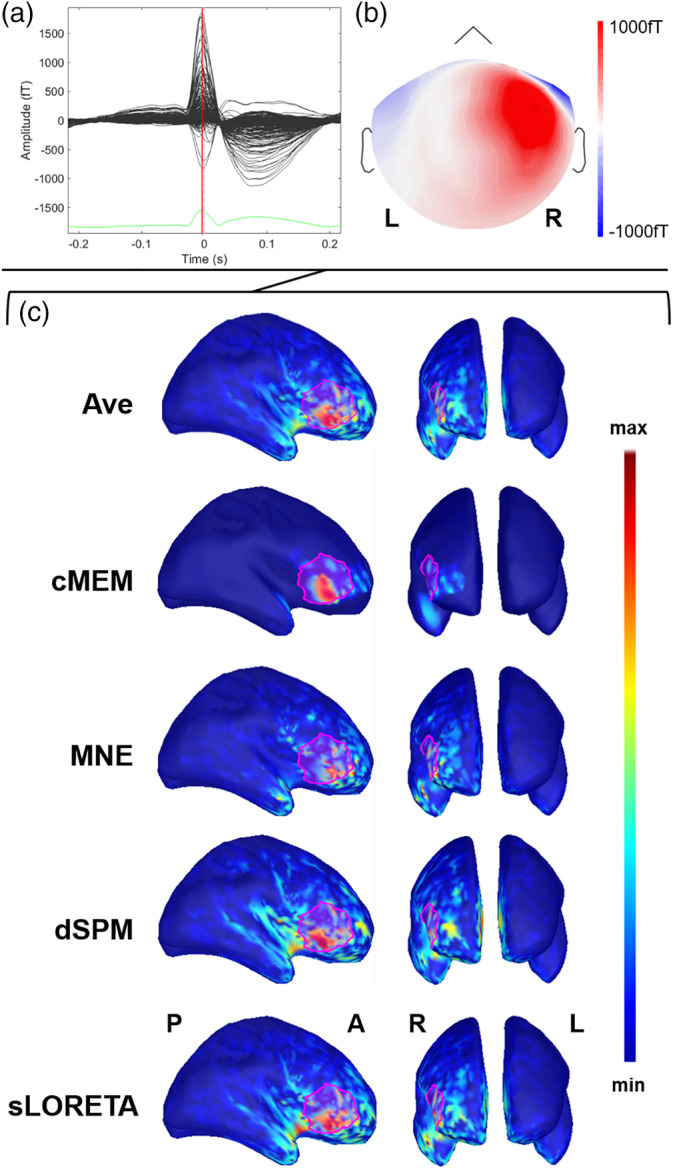
Figure 4.

Example of patient with focal epilepsy originating from the right frontal operculum (Patient 11). (a) The average interictal epileptiform discharge (IED). Source imaging is considered at its peak marked by the vertical red line. (b) The magnetic topographical distribution at the peak of the IED. (c) The nonthresholded distributed magnetic source imaging (dMSI) maps for all methods. Cortical surface has been inflated to improve its visualization. The reconstruction of the epileptic focus based on clinical information is depicted in magenta. All the dMSI methods provide a good localization of the epilepsy focus. Coherent maximum entropy on the mean (cMEM) map shows high contrast, with the maximum centered in the right frontal operculum and very little activity spreading outside the epileptic focus. Standardized low‐resolution electromagnetic tomography (sLORETA) shows a higher amount of activity outside the epileptic focus and some strong localization in the anterior insula. Dynamic statistical parametric mapping (dSPM) map shows very similar features to sLORETA. Minimum norm estimate (MNE) retrieved a less blurred map when compared to sLORETA and dSPM, with a maximum in the right frontal operculum, but also some activity spread over the right frontal and temporal pole. Ave shows a good localization, with less spatial spreading as compared to sLORETA, dSPM, and MNE
