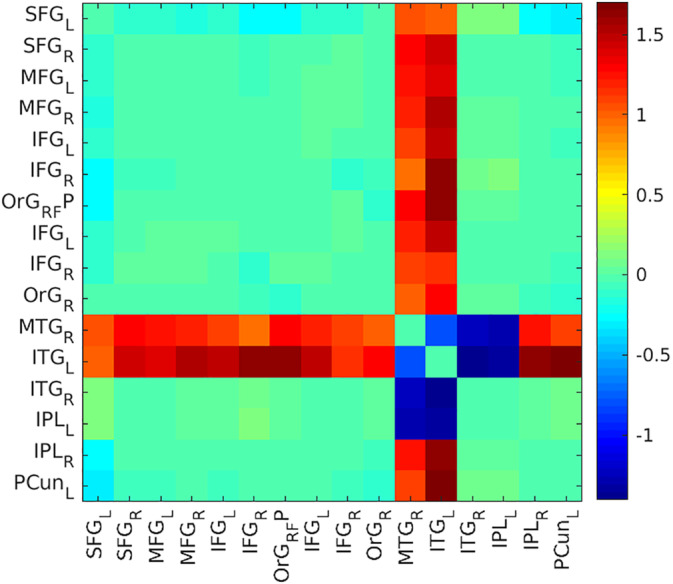
Figure 3.

Matrix of group difference of the QPP time course correlation. Differences (Z[r]) were obtained by a subtraction of the average z‐transformed Pearson correlation values of HCs minus FEP patients. The color bar corresponds to a z‐transformed Pearson correlation for the differences. FEP, first‐episode psychosis; HCs, healthy controls; QPP, quasiperiodic pattern
