
FIGURE 1.
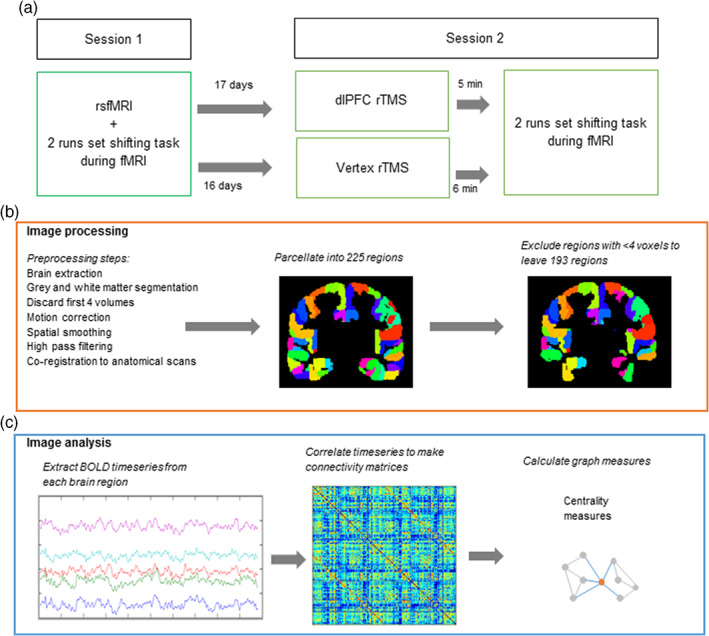
Study design and image processing/analysis. (a) Study design. All participants attended two sessions. During the first session, participants underwent an rsfMRI scan and carried out a set‐shifting task during two separate runs of fMRI. Participants were then randomised to either verum (left dLPFC) or control (vertex) repetitive transcranial magnetic stimulation (rTMS) groups. After 16–17 days, participants attended the second session. They received rTMS, followed directly by carrying out the set‐shifting task during two separate runs of fMRI. (b) Image processing steps: fMRI scans were preprocessed and parcellated into 225 regions. This was followed by exclusion of regions containing <4 voxels. (c) Image analysis steps: FC and graph theoretical analysis: The BOLD timeseries was extracted from each parcellated region. Pearson correlations were carried out between each pair of regions, giving a 193 × 193 correlation matrix for each participant. These matrices were then used to calculate centrality graph measures