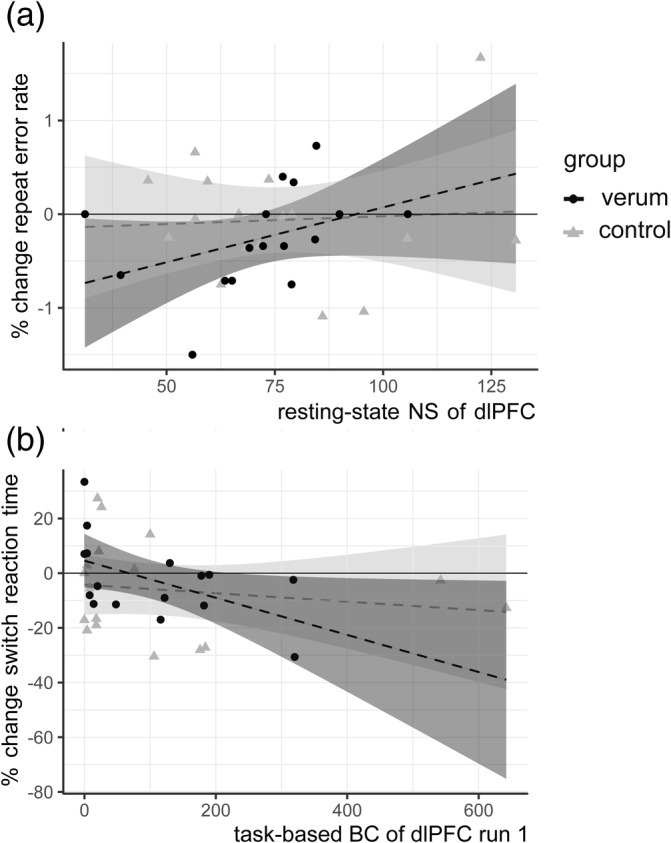
FIGURE 2.

Correlations between baseline fMRI graph measures and change in cognitive performance after low frequency (LF) repetitive transcranial magnetic stimulation (rTMS): (a) Higher resting state node strength (NS) of the left dorsolateral prefrontal cortex (dlPFC) node is associated with an increase in RER in the verum group (τ = 0.447, p = .017, 95% CI [0.138, 0.781]) but not in the control group (τ = −0.170, p = .343, 95% CI [− 0.527, 0.214]; z = 2.696, p = 0.007). (b) Lower betweenness centrality (BC) of the dlPFC node is associated with an increase in SRT in the verum group after TMS (τ = −0.403, p = .03, 95% CI [−0.733, −0.031]) but not in the control group (τ = −0.067, p = .710, 95% CI [−0.327, 0.267]; z = −2.040, p = 0.04). Shaded areas on plot correspond to (linear) 95% CIs. Note that a linear correlation line and 95% CIs are drawn in these figures, but this association was tested nonparametrically
