FIGURE 4.

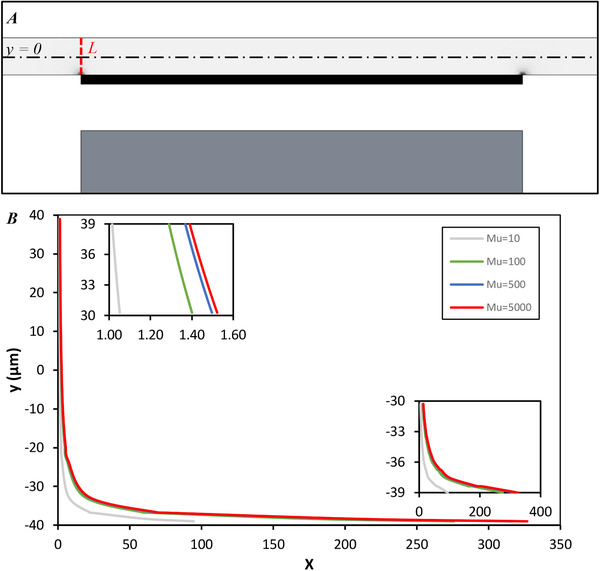
(A) H∇B within the channel is demonstrated. Brighter color means lower. (B) Parameter X along line of L for different relative permeabilities of 10, 100, 500, and 5000

(A) H∇B within the channel is demonstrated. Brighter color means lower. (B) Parameter X along line of L for different relative permeabilities of 10, 100, 500, and 5000