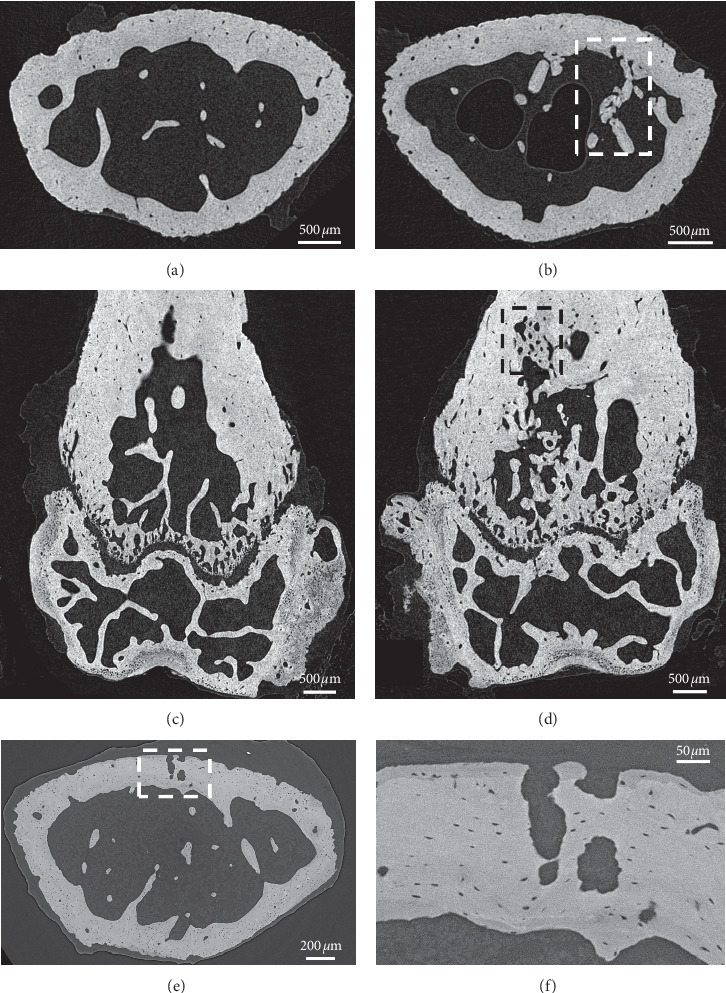
Figure 5.

MicroCT and PCE-CT images of a control, left (noninjected), and a right femur injected with MOPC315.BM.Luc cells at day 15 after inoculation. Transversal cross sections of high-resolution microCT images of the left (a) and right (b) femur metaphysis demonstrate a typical region of disrupted trabeculae (highlighted by the rectangular area in (b)). Longitudinal, frontal cross sections of high-resolution microCT images of the left (c) and right (d) femora showing a region of high bone turnover and bone healing in the rectangular area in (d). (e) PCE-CT cross-sectional image of the same right femur metaphysis as shown in (b). (f) High-magnification view of the rectangular area in (e) reveals cavitation and irregular-shaped osteolytic lesions in the cortex.
