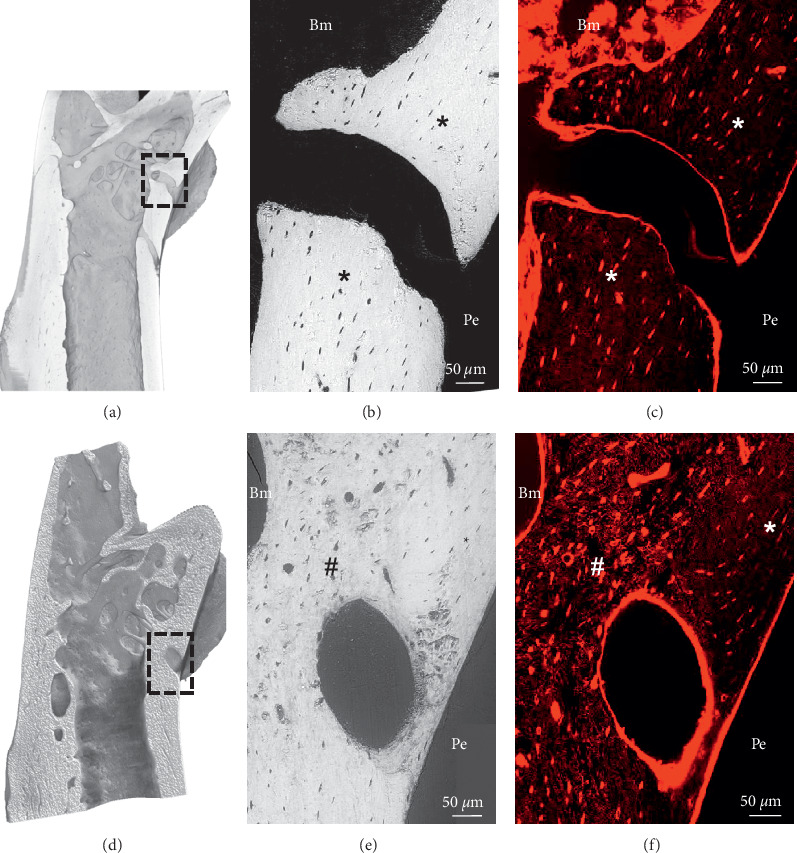
Figure 6.

Electron and fluorescence confocal laser scanning microscopy for bone ultrastructural characterization of femora injected with PBS (a–c) and MOPC315.BM.Luc cells (d–f) at day 21. (a, d) 3D renderings of microCT scans of embedded proximal femora showing large cavities corresponding to blood vessels in the cortical bone. (b, c) Detailed views of the region indicated by the rectangle in (a). (b) BSE image shows intact osteocyte lacunae (indicated with ∗). (c) CLSM imaging of the rhodamine-stained sample reveals only well-organized OLCN (indicated with ∗). (e, f) Detailed views of the region indicated by the rectangle in (d). (e) BSE image reveals osteocyte cross sections and local variations in mineral content, based on signal from the mineralized components of the matrix. (f) CLSM imaging of the rhodamine-stained sample reveals nonmineralized regions within cortical bone, including osteocyte lacunae and canaliculi network. Correlative BSE and CLSC imaging show flat osteocyte lacunae organized (indicated with ∗) in a lamellar structure on the periosteal region (Pe) and larger, irregular-shaped lacunae within a disorganized (indicated with #) canaliculi network architecture in the proximity of the bone marrow (Bm).
