Figure 2.

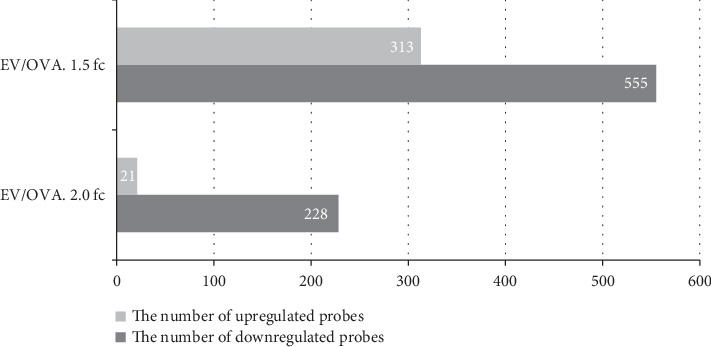
Bar plot of significant probes. We identified 868 and 249 differentially expressed genes (DEGs) with fold changes of ∣logFC | ≥1.5 and ∣logFC | ≥2.0 between the EV and OVA groups, respectively.

Bar plot of significant probes. We identified 868 and 249 differentially expressed genes (DEGs) with fold changes of ∣logFC | ≥1.5 and ∣logFC | ≥2.0 between the EV and OVA groups, respectively.