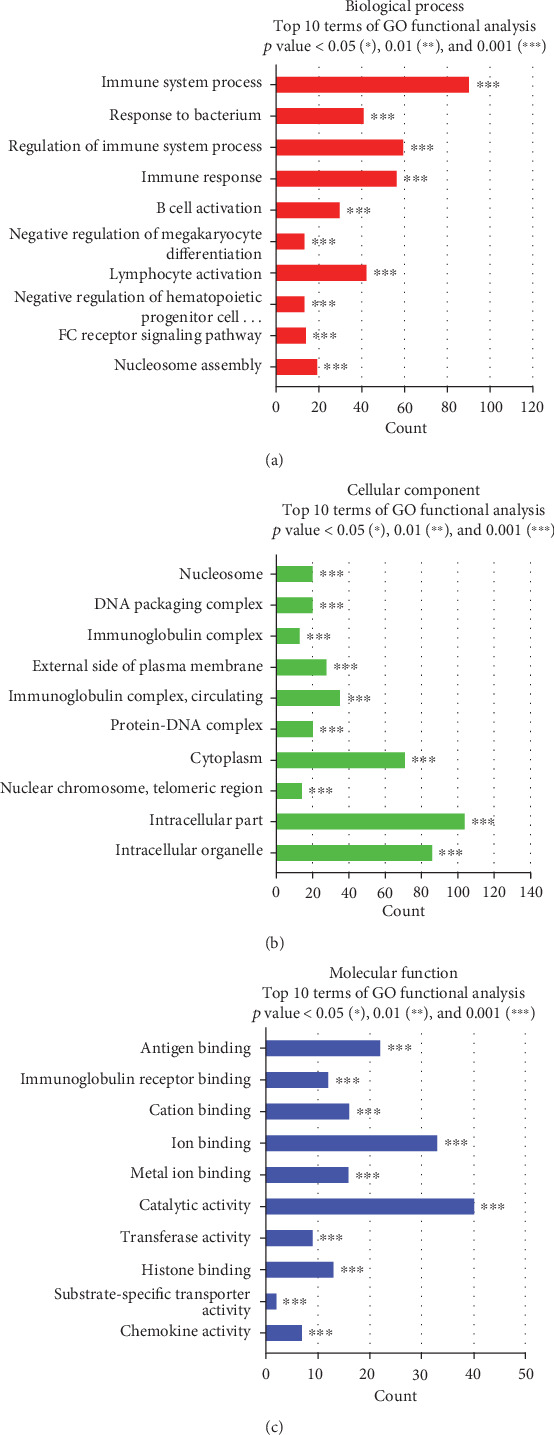
Figure 5.

Functional category enrichment analysis of DEGs. The y-axis shows significantly enriched gene ontology (GO) terms, and the x-axis shows the counts of these terms. GO analysis included three categories: (a) biological processes, (b) cellular components, and (c) molecular function.
