Figure 6.

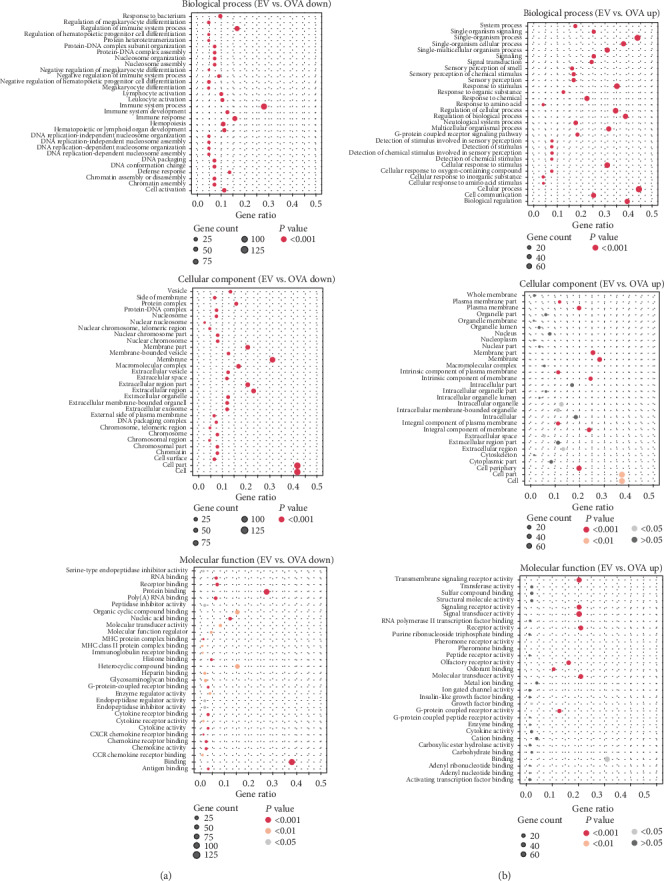
Bubble chart of gene ontology term association. Bubble size indicates the number of (a) downregulated or (b) upregulated genes for the corresponding annotation.

Bubble chart of gene ontology term association. Bubble size indicates the number of (a) downregulated or (b) upregulated genes for the corresponding annotation.