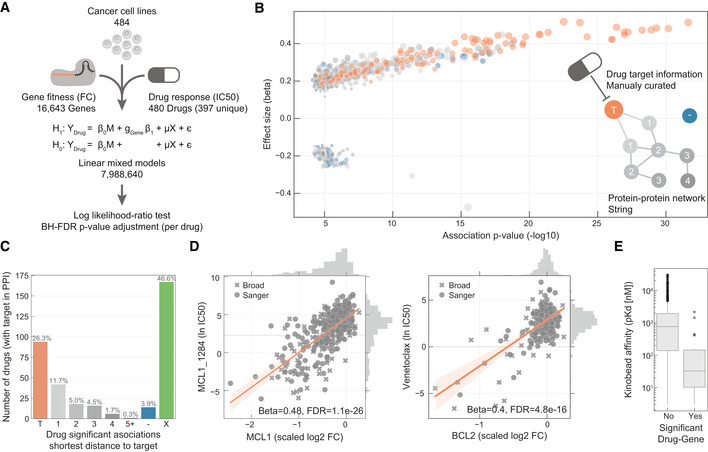
Figure 1. Integration of drug and CRISPR gene dependencies in cancer cell lines.

- Linear models were used to integrate drug sensitivity (IC50 values) and gene fitness measurements.
- Volcano plot showing the effect sizes and the P‐value for statistically significant associations, Benjamini–Hochberg false discovery rate (FDR)‐adjusted likelihood‐ratio test P‐value < 10%. Drug–gene associated pairs are coloured according to their shortest distance in a protein–protein interaction network of the gene to any of the nominal target of the drug.
- Percentage of the 358 drugs with significant associations and their shortest distance in the PPI network to the drug nominal targets. T represents drugs that have a significant association with at least one of their canonical targets, “−” represents no link was found, and X are those which have no significant association.
- Examples of the top drug response correlations with target gene fitness. Each point represents an individual cell line. MCL1_1284 and venetoclax are MCL1 and BCL2 selective inhibitors, respectively. Gene fitness log2 fold changes (FC) are scaled by using previously defined sets of essential (median scaled log2 FC = −1) and non‐essential (median scaled log2 FC = 0) genes. Drug response IC50 measurements are represented using the natural log (ln IC50).
- Kinobead affinity is significantly higher (lower pK d) for compounds with a significant association with their target (n = 20, Mann–Whitney P‐value = 3.1e‐07). Box‐and‐whisker plots show 1.5× interquartile ranges and 5–95th percentiles, centres indicate medians.
