-
A
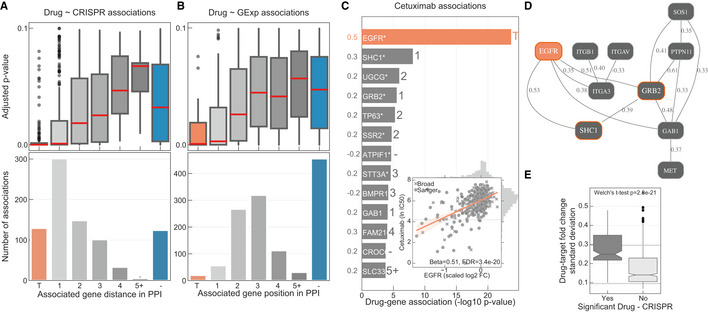
Distribution of the FDR‐adjusted P‐values (top) and count (bottom) of the significant (FDR‐adjusted likelihood‐ratio test P‐value < 10%) drug–gene (CRISPR) associations according to their distance between the gene and corresponding drug targets in the protein–protein interaction network. T represents drugs that have a significant association with at least one of their canonical targets and “−” represents no link was found. Box‐and‐whisker plots show 1.5× interquartile ranges and 5–95th percentiles, centres indicate medians.
-
B
Similar to (A), but instead gene expression (GExp) was tested to identify associations with drug response. T represents drugs that have a significant association with at least one of their canonical targets and “−” represents no link was found. Box‐and‐whisker plots show 1.5× interquartile ranges and 5–95th percentiles, centres indicate medians.
-
C, D
(C), Representative example, i.e. cetuximab—EGFR inhibitor, of the associations and (D), networks that can be obtained from the integrative analysis. Edges in the network are weighted with the Pearson correlation coefficient obtained between the fitness profiles of interacting nodes. For representation purposes only edges with the highest correlation coefficient were represented, R
2 > 0.3. Nodes with orange borders represent significant associations with drug response, cetuximab.
-
E
Drug–target associations grouped by statistical significance (FDR‐adjusted likelihood‐ratio test P‐value < 10%) and plotted against the standard deviation of the drug–target CRISPR fold changes (significant “Yes” n = 129, significant “No” n = 684). Upper and lower dashed lines represent the standard deviations of essential and non‐essential genes, respectively. Box‐and‐whisker plots show 1.5× interquartile ranges and 5–95th percentiles, centres indicate medians.

