
Figure EV2. Overview of the CRISPR‐Cas9 data sets.
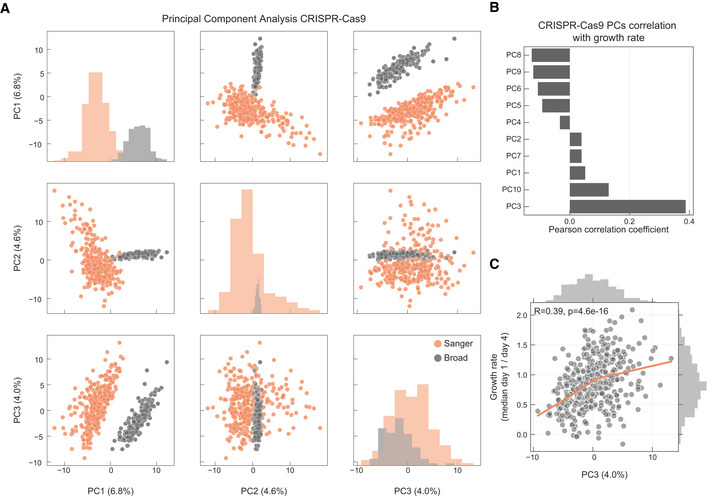
- PCA analysis of the samples in the CRISPR‐Cas9 screens, samples institute of origin is highlighted.
- Correlation coefficients between all top 10 PCs and growth rate.
- Correlation between cell lines growth rate and PC3 (Pearson correlation coefficient reported in the top left).