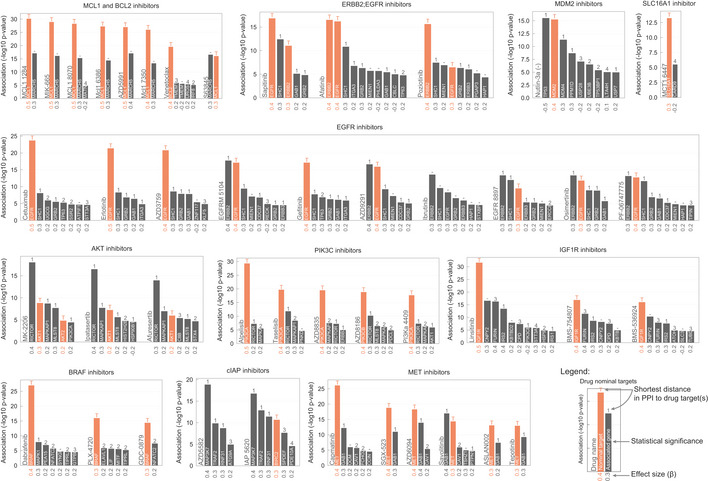
Figure 3. Representative examples of top most significantly associated drug classes.

Each bar plot group represents a unique drug where genes are ranked by statistical significance (likelihood‐ratio test P‐value) of their association. Effect sizes of the associations are reported under the bars along the x axis. Shortest distance (number of interactions) in a protein–protein interaction network between the gene and the drug nominal target(s) is represented on the top of the bars, where T and orange bar represent the target and ““−” represents no link was found.
