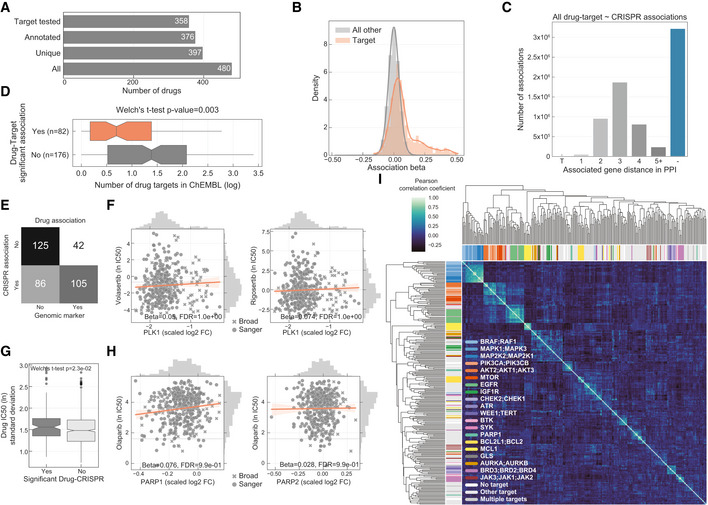
Total number of drugs utilised in the study and the different levels of information available: “All” represents all the drugs including replicates screened with different technologies (GDSC1 and GDSC2); “Unique” counts the number of unique drug names; “Annotated” shows the number of unique drugs with manual annotation of nominal targets; and “Target tested” represents the number of unique drugs, with target information, for which the target has been knocked‐out in the CRISPR‐Cas9 screens.
Histogram of the drug–gene associations effect sizes (beta) highlighting drug–target associations.
Distribution of the shortest path lengths between all the tested drug–gene pairs. For drugs with multiple targets the smallest shortest path of all the targets was taken. T represents the drug target and “−” represents no link was found.
Distribution of number of drug targets found in an unsupervised way using the ChEMBL database. Drugs are grouped by having significant drug–target associations. Box‐and‐whisker plots show 1.5× interquartile ranges and 5–95th percentiles, centres indicate medians.
Contingency matrix of significant drug associations with CRISPR fold changes and binarised event matrix of genomic features, i.e. mutations and copy number gain or loss.
PLK1 inhibitors drug response correlation with PLK1 knockout log2 fold change (FC) gene fitness effects. The dashed grey line indicates the dose response highest drug concentration.
Drug–target associations split by significance (FDR‐adjusted likelihood‐ratio test P‐value < 10%) plotted against the standard deviation of the drug IC50 (ln) measurements of the respective pair (significant “Yes” n = 129, significant “No” n = 684). Box‐and‐whisker plots show 1.5× interquartile ranges and 5–95th percentiles, centres indicate medians.
Similar to (F), correlation of olaparib drug response and both targets PARP1 and PARP2 gene fitness effects.
Correlation heatmap of the drug–gene effect size across all the genes. Drugs are coloured according to their targets.

