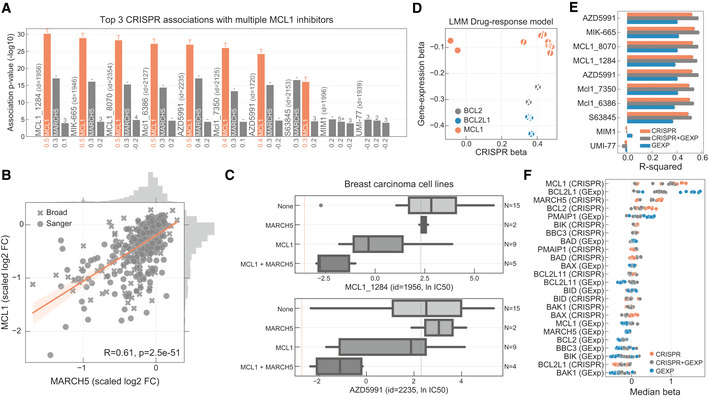
Top three CRISPR associations with all MCL1 inhibitors screened. Each bar represents the likelihood‐ratio test P‐value of each drug–gene (CRISPR) association and effect sizes reported under the bars. Shortest distance (number of interactions) in a protein–protein interaction network between the gene and the drug nominal target(s) is represented on the top of the bars, where T and orange bar represent the target and “−” represents no link was found.
Association between the gene fitness profiles of MCL1 and MARCH5.
Stratification of the MCL1 inhibitor sensitivity according to the essentiality profile of MCL1 and MARCH5, where MCL1 + MARCH5 represents a cell line that is independently dependent on both genes. Dashed orange line (left) represents the mean IC50 in acute myeloid leukaemia cell lines. Grey dashed line (right) represents the maximum concentration used in the dosage response curve. Box‐and‐whisker plots show 1.5× interquartile ranges and 5–95th percentiles, centres indicate medians.
BCL2, BCL2L1 and MCL1 inhibitors and the respective association with their targets, on the x axis with CRISPR gene fitness and on the y axis with gene expression. The statistical significance (FDR‐adjusted likelihood‐ratio test P‐value < 10%) of the association is represented with a backward slash for CRISPR and forward slash for GEXP.
Regularised multilinear regression to predict drug response of all MCL1 inhibitors using gene expression, fitness or both of known regulators of the BCL2 family and MARCH5. Predictive performance is estimated using R
2 metric represented in the x axis.
Effect size of each feature used in each MCL1 inhibitor model.

