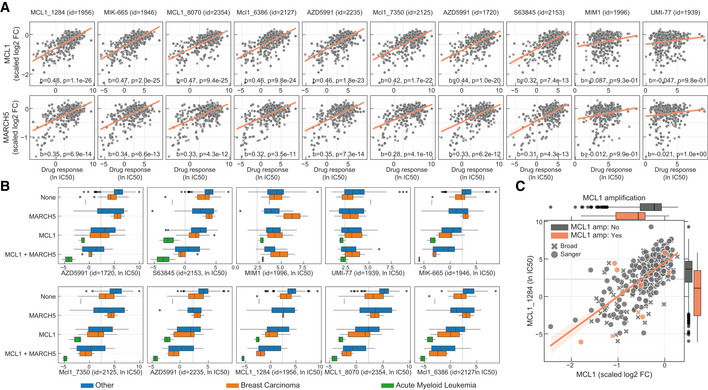
Stratification of the MCL1 inhibitors drug response measurements according to the cell line dependency on MARCH5 and/or MCL1. Gene vulnerabilities are independent from each other, meaning knockouts were introduced independently and not at the same time. Responses are then split according to the cancer type of the cell lines. Number of measurements per boxplot are: acute myeloid leukaemia (MCL1 = 3, MCL1 + MARCH5 = 2, None = 1), breast carcinoma (MARCH5 = 2, MCL1 = 9, MCL1 + MARCH5 = 4, None = 14) and Other (MARCH5 = 9, MCL1 = 52, MCL1 + MARCH5 = 21, None = 236). Vulnerable cell lines to MARCH5 and MCL1 knockout were defined as those with a depletion of at least 50% of that visible for essential genes on the particular cell line (scaled log2 fold change < −0.5). Grey dashed line represents the maximum concentration used in the dosage response curve of the respective drug. Box‐and‐whisker plots show 1.5× interquartile ranges and 5–95th percentiles, centres indicate medians.

