
Figure 5. Robust pharmacological associations.
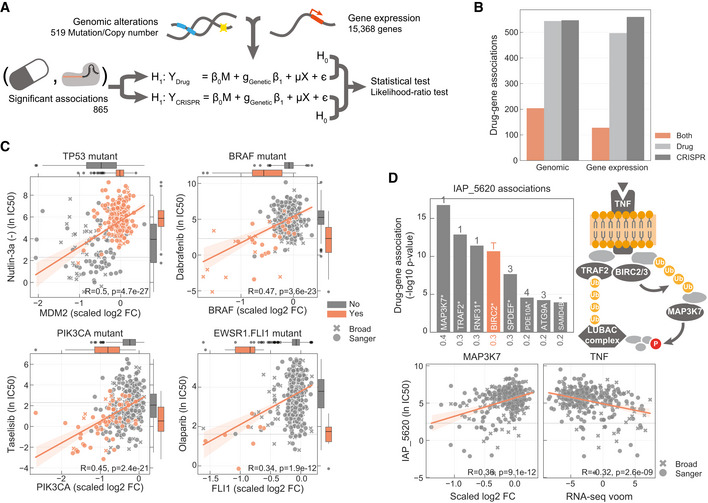
- Diagram representing how genomic and gene expression data sets are integrated to identify significant associations with drug–gene pairs that were previously found to be significantly correlated.
- Number of drug–gene pairs with at least one significant association with drug response, gene fitness or both, considering either genomic or gene expression profiles.
- Canonical examples of robust pharmacological associations. Box‐and‐whisker plots show 1.5× interquartile ranges and 5–95th percentiles, centres indicate medians.
- Representative example of a BIRC2/BIRC3 inhibitor, IAP_5620, showing the significant associations (FDR‐adjusted likelihood‐ratio test P‐value < 10%) with CRISPR gene fitness profiles and their location in a representation of the TNF pathway. Bar plot is defined similarly to Fig 3.