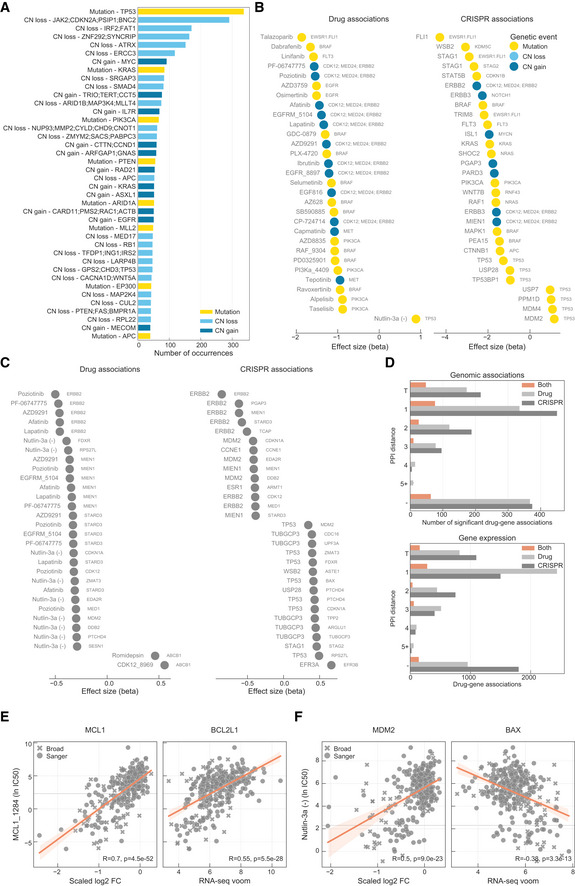
Figure EV5. Robust pharmacological associations.

-
AMost frequent genomic alterations across the cancer cell lines.
-
B, CMost significant associations between (B), genomic features and (C), gene expression profiles with drug response and gene fitness.
-
DNumber of significant drug–gene pairs across the different types of interactions. Drug–gene pairs were categorised considering the shortest path length between the drug target(s) and the associated gene. T represents the drug target and “−” represents no link was found.
-
ERobust pharmacological association between the expression of BCL2L1 and the significantly correlated pair of MCL1_1284 drug and MCL1 gene fitness profile.
-
FSimilarly to (E), but instead it represents a robust pharmacological association between BAX and MDM2 and Nutlin‐3a.
