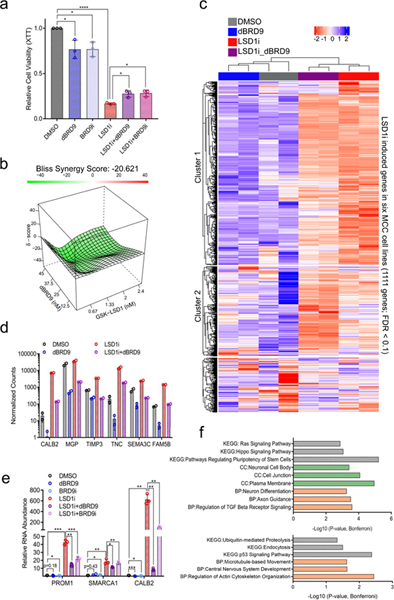
Fig. 7. LSD1 and BRD9 regulate an overlapping set of genes in MCC.

a. BRD9 degradation or inhibition partially rescues the reduced cell viability caused by LSD1 inhibition in MCC. MKL-1 cells were treated with DMSO, GSK-LSD1 (LSD1i, 0.1 μM), dBRD9 (1 μM), BRD9i (BI-7273, 1 μM), or combinations of LSD1i with dBRD9 or BRD9i for six days. The XTT assay was used to measure relative cell viability. Data are shown as mean of n=3 ± SD; two-sided t-test, *P<0.05, ****<0.00005. b. MKL-1 cells were treated with varying doses of GSK-LSD1 or dBRD9 for six days. SynergyFinder48 was used to calculate negative synergy (rescue) scores. c. RNA-seq was performed with two replicates of MKL-1 cells treated with DMSO, GSK-LSD1 (LSD1i, 0.1 μM), dBRD9 (0.1 μM), or both GSK-LSD1 and dBRD9 for six days. n=2. The heatmap shows expression changes in 1,111 genes induced by LSD1i in six virus-positive MCC cell lines (Fig. 3a-c and Source Data 7). d. DESeq2 counts of selected LSD1 target genes are shown. Multiple t-test was performed and p-valued were adjusted by FDR (See Supplementary Table 3). Data are shown as mean of n=2 ± SD. e. Selected GOTERM biological processes (BP), cellular components (CC), or KEGG -log10 of p-values for the pathways enriched with the Cluster 1 and 2 genes (Source Data 7). The clustering test was implemented using kappa statistics45. n=2. f. MKL-1 cells were treated with DMSO, LSD1i (GSK-LSD1, 0.05 μM), dBRD9 (1μM), BRD9i (BI-7273, 1 μM), LSD1i with dBRD9, or LSD1i with BRD9i for three days. The signals were normalized to the DMSO treated sample and RPLP0. Data are shown as mean of n=3 ± SD; two-sided t-test, *P<0.05; **<0.005; ***<0.0005.
