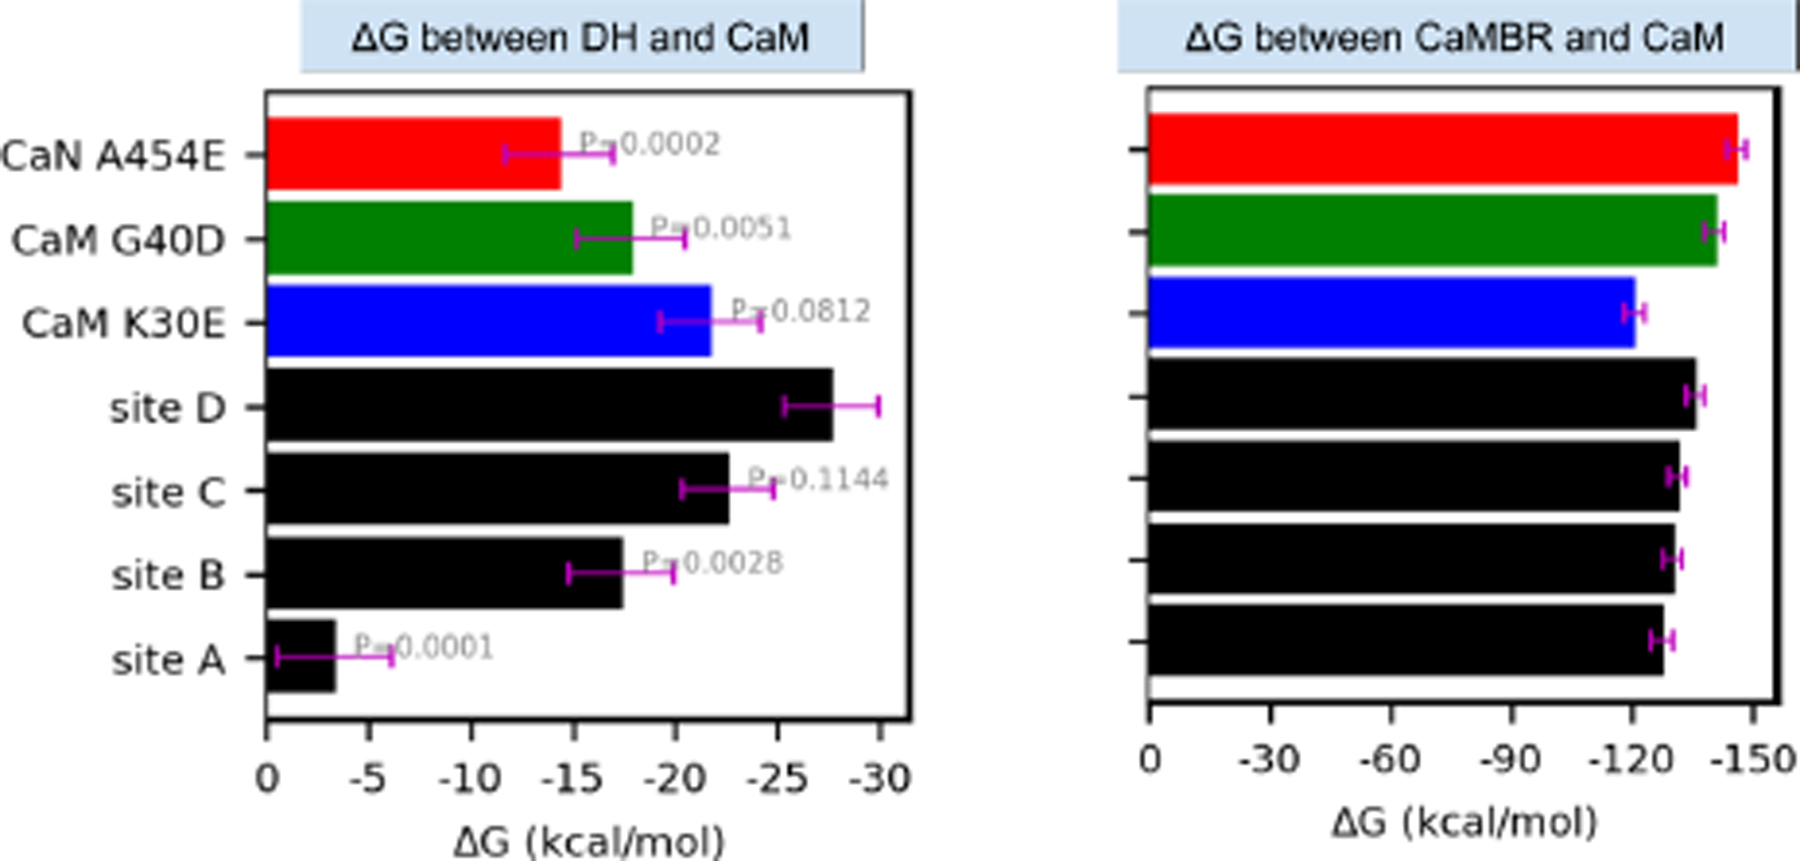
Figure 4:

Approximate binding free energies between CaM and the distal helix (left) or CaMBR regions (right) via Molecular Mechanics-Generalized Born and Surface Area continuum solvation (MM-GBSA). Black bars correspond to wild-type CaN, whereas colored bars utilize the A454E CaN and CaM variants. The calculation was conducted on frames extracted every 2 ns from MD trajectories. The error bar represents standard error of the mean. The values above bars in the left panel are P values of each case with null hypothesis that their mean values are equal to site D.
