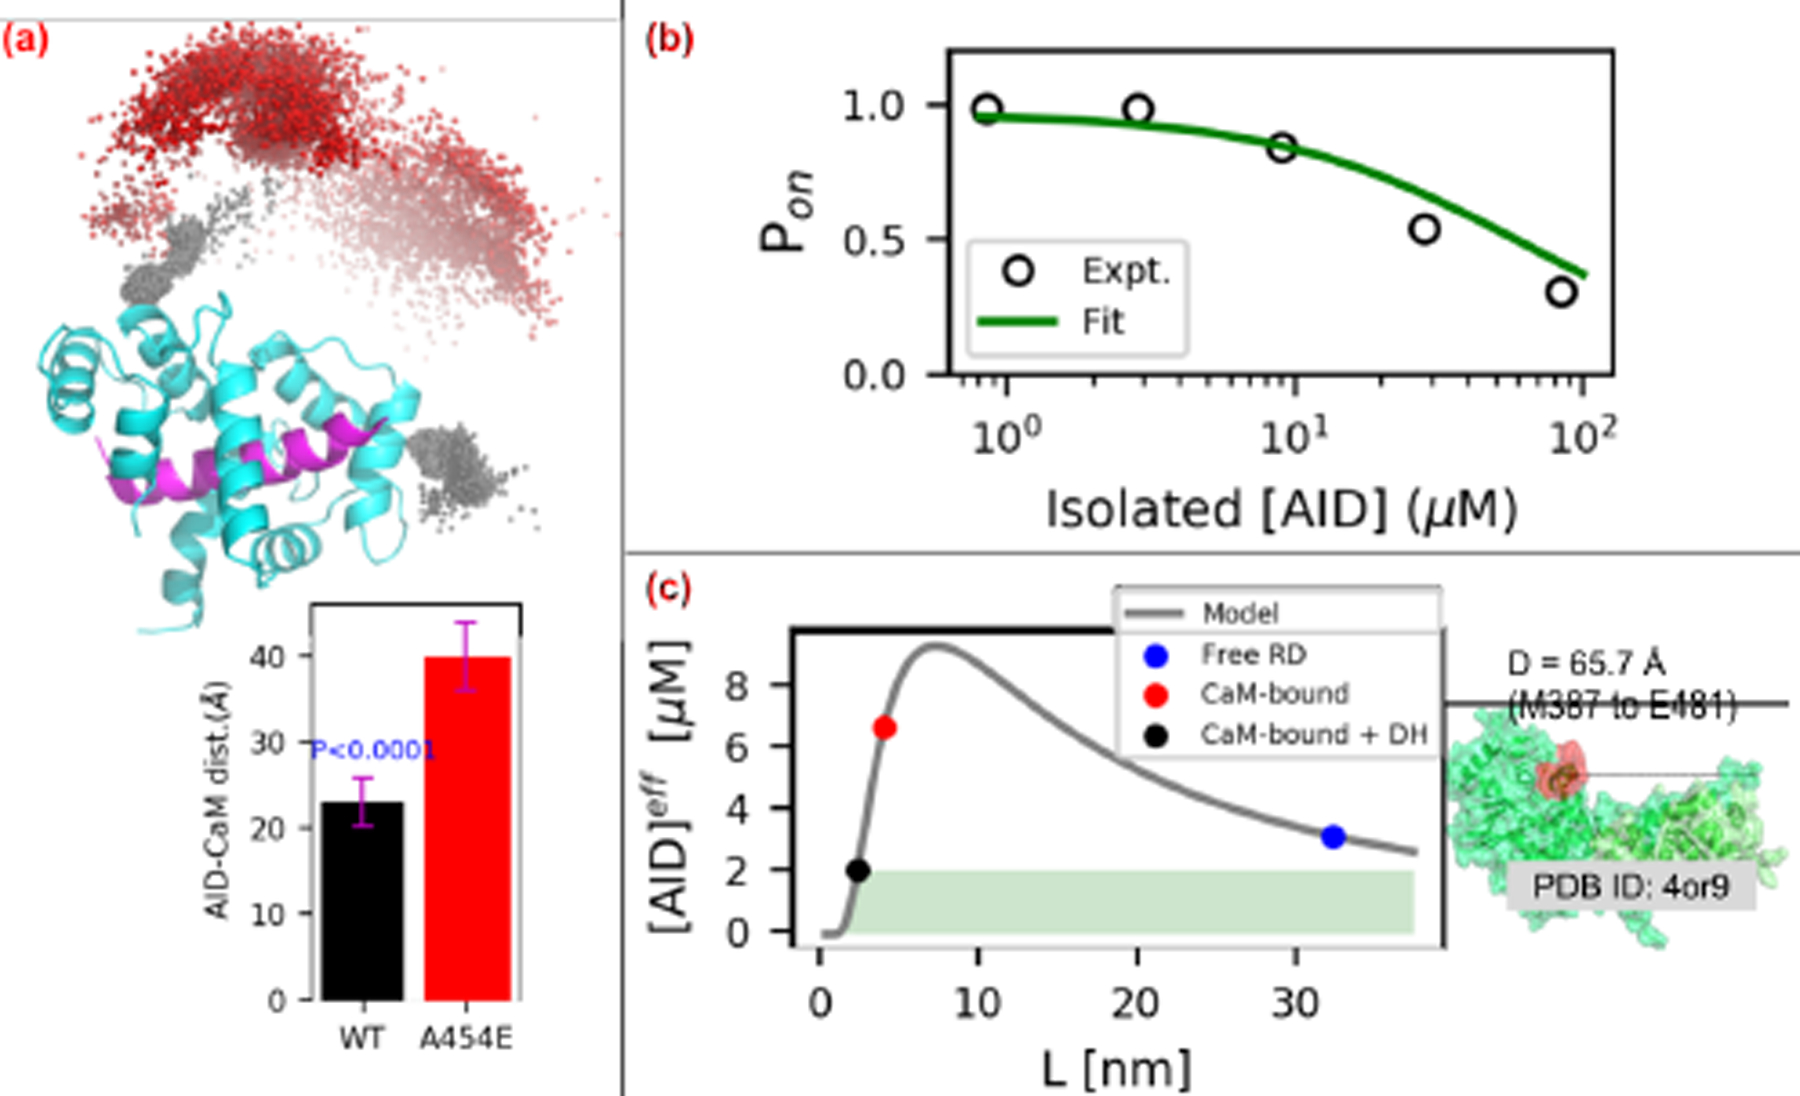
Figure 9:

(a) Distribution of AID center of mass (COM) relative to the CaM/CaMBR complex. The black and red spheres represent the COMs of AID in WT and A454E cases, respectively. The lower panel depicts distance between COMs of AID and CaM. The P-value above the WT bar is for the null hypothesis that the WT center of mass is the same as that of A454E. (b) Fitting of the competitive-inhibitor model (Eq. 5) to experimental data from (77). (c) Effective AID concentrations calculated via Eq. 4. The shaded green area represents effective [AID] that leads to CaN’s activation. Right panel illustrates the assumed distance between CaMBR and catalytic site. The value is set as 66 Å in this study.
