
Figure 2.
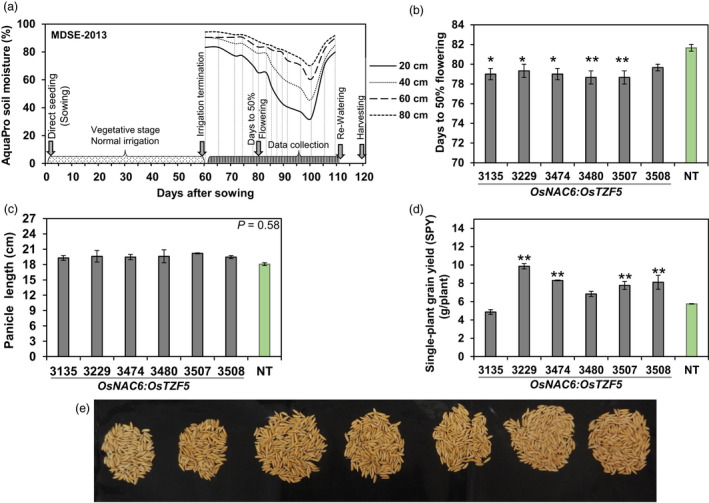
POsNAC6:OsTZF5 expressed in Curinga plants improves rice grain yield in the MDSE‐2013 trial using a rainout shelter. (a) AquaPro soil moisture profile during the drought stress period. Lines denote soil moisture at four different depths (20, 40, 60 and 80 cm). Arrowheads indicate drought stress scheduling and sampling times. (b) Variation in flowering time. (c) Panicle length. (d) Single‐plant grain yield (SPY) of Curinga transgenic lines. (e) Images showing single‐plant grain yield obtained in the MDSE trial. Each flowering time value represents the mean ± SE from three replications (at plot level). Each panicle length and single‐plant yield value represents the mean ± SE from three replications (eight plants per each replication). Asterisks denote values different from NT Curinga plants by Dunnett’s test: *P < 0.05, **P < 0.01.