Figure 1.

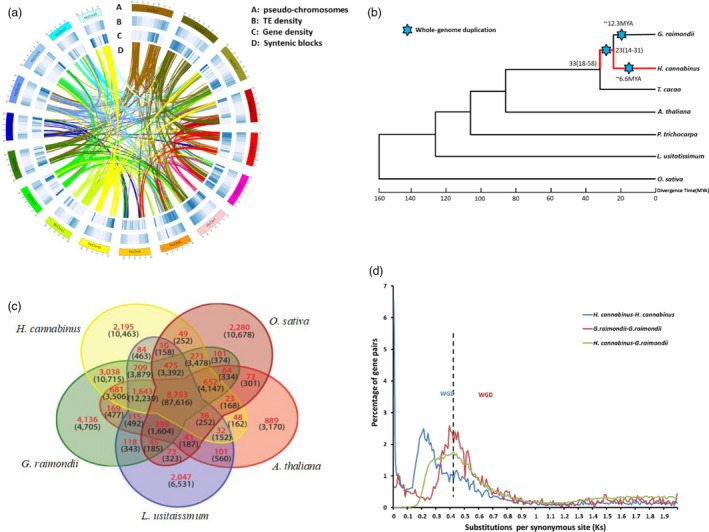
Comparative analyses and evolution of the H. cannabinus genome. (a) Basic genome information, including pseudo‐chromosomes (A), transposable elements density (B), gene density (C) and syntenic block (D), in H. cannabinus. (b) Phylogenetic analysis of seven sequenced plant genomes with O. sativa as an outgroup. H. cannabinus diverged from H. cannabinus‐G. raimondii common ancestor 23 million years ago (Mya) with the confidence interval ranging from 14 to 31 Mya. Blue stars indicate whole‐genome duplication (WGD). (c) Venn diagram of unique and shared gene families among five representative genomes. The analysis was performed with gene families common to the five genomes. (d) Ks distributions of all homologous gene pairs in the H. cannabinus and G. raimondii genomes. The y‐axis shows the percentage of two‐member gene clusters.
