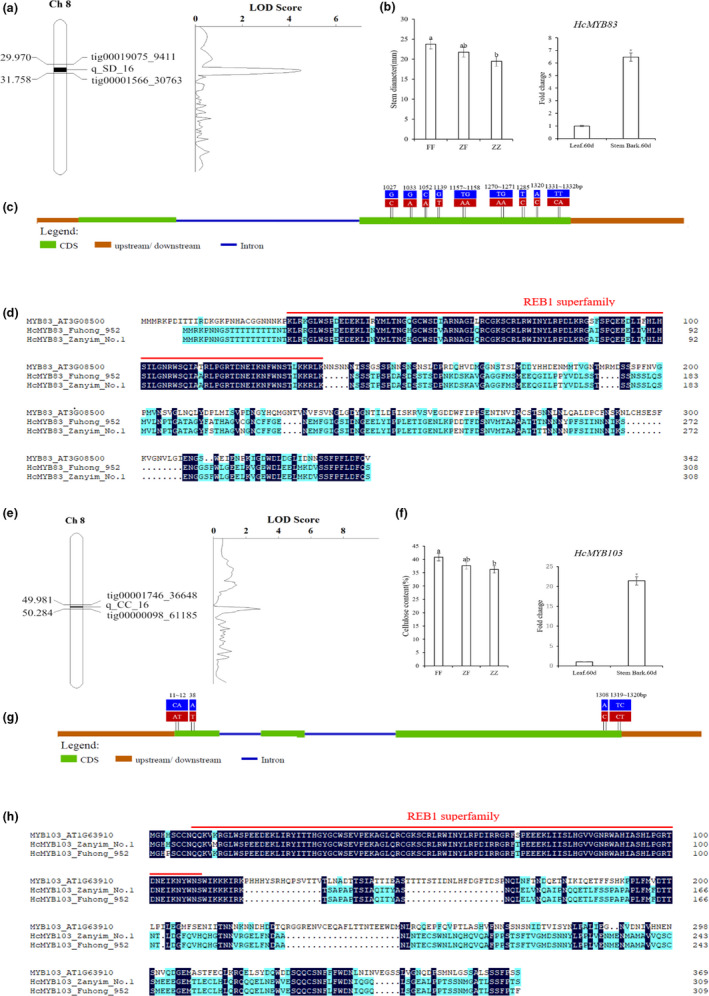
Figure 3.

Candidate genes underlying related to bast fibre development. (a) One putative QTL of stem diameter was mapped on Chromosome 8 using the high‐density genetic linkage map. (b) Stem diameters among the three genotypes of HcMYB83(Hca.08G0001750) and expression profile of this gene between leaf.60d and stem bark.60d. (c) Gene structure and variation in the candidate gene of HcMYB83. Exons and introns are represented by boxes and lines, respectively. The positions of the causal micro‐structure variation are marked. Red and blue boxes represent P1‐’Zanyin No. 1’ and P2‐‘Fuhong 952’ respectively. (d) Amino acid comparison of HcMYB83 between P1‐’Zanyin No. 1’ and P2‐‘Fuhong 952’. (e) One putative QTL of cellulose content of bast fibre was mapped on Chromosome 8 using the high‐density genetic linkage map. (f) Stem diameters among the three genotypes of HcMYB103(Hca.08G0028100) and expression profile of this gene between leaf.60d and stem bark.60d. (g) Gene structure and variation in a candidate gene of HcMYB103. Exons and introns are represented by boxes and lines, respectively. The positions of the causal micro‐structure variation are marked. Red and blue boxes represent P1‐’Zanyin No. 1’ and P2‐‘Fuhong 952’, respectively. (h) Amino acid comparison of HcMYB103 between P1‐’Zanyin No. 1’ and P2‐‘Fuhong 952’.
