
Figure 4.
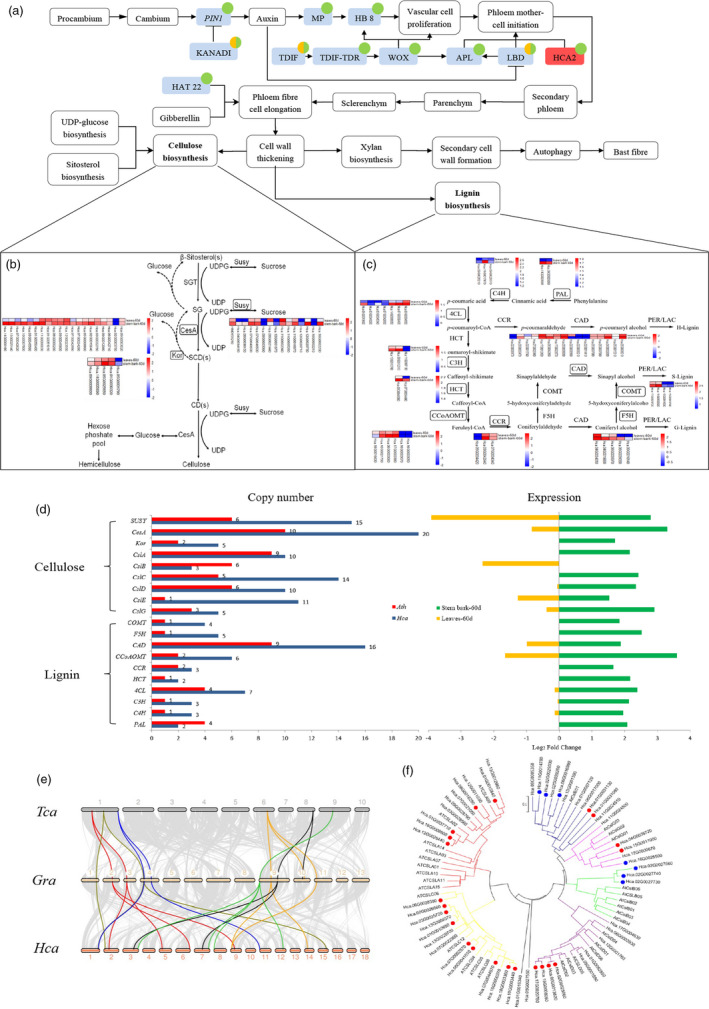
Fibre development and transcriptome comparison of genes involved in lignocellulosic biosynthesis enzymes in H. cannabinus. (a) Schematic representation of the fibre formation process. Fibre formation‐related genes are listed in Table S25. Blue: the more copy number in H.ca than A.th; Red: the same copy number in H.ca and A.th; Green: the gene is expressed in stem bark.60d (60 days after germination undergoing bast fibre formation); Yellow: the gene is expressed in leaf.60d. (b) The expression profile of leaf.60d and stem bark.60d in cellulose synthesis pathway at the vegetable stage of kenaf. (c) The expression profile of leaf.60d and stem bark.60d in the lignin synthesis pathway at the vegetable stage of kenaf. (d) Comparison of copy numbers of genes involved in lignocellulosic biosynthesis enzymes between Hca and Ath (is shown on the left). Comparison of relative RNA‐Seq expression of lignocellulosic biosynthetic enzymes in leaf.60d and stem bark.60d (is shown on the right). Hca, H. cannabinus; Ath, A. thaliana. (e) Synteny analysis among T. cacao, G. raimondii and H. cannabinus genomes. Grey lines in the background highlight conserved synteny blocks with more than 10 genes. Cellulose synthase A (CesA) genes in the synteny block are highlighted by different colours, shown in Table S26. (f) The phylogeny of cellulose synthase‐like (Csl) genes in H. cannabinus and A. thaliana. Different colour circles show differential expression between leaf.60d and stem bark.60d at the vegetable stage, respectively. Red circles represent up‐regulation at stem bark.60d, while blue ones indicate up‐regulation at leaf.60d.