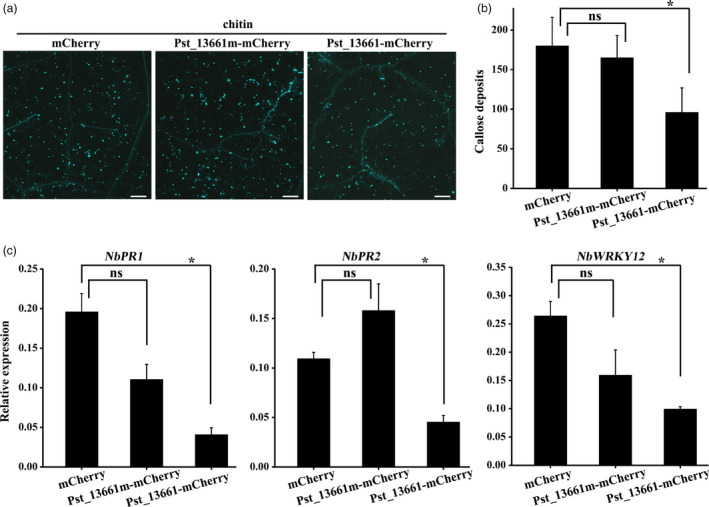
Figure 8.

Pst_13661 suppresses chitin‐induced plant defence in N. benthamiana. (a) Callose deposition induced by 200 µg/mL chitin in tobacco leaves transiently expressing Pst_13661: mCherry, Pst_13661m: mCherry or mCherry alone. Images were obtained 24 h after infiltration with chitin. Bar = 200 μm. (b) Pst_13661 suppresses callose spots in N. benthamiana. The number of callose spots per 1‐mm2 was assessed with the ImageJ software. Mean and standard deviations were calculated from three biological replicates. Asterisks mark significant difference based on Student’s t‐test (*, P < 0.05; ns, not significant). (c) The expression levels of PR1, PR2 and WRKY12 in N. benthamiana leaves transiently expressing Pst_13661: mCherry, Pst_13661m: mCherry or mCherry after infiltration with chitin were assayed by qRT‐PCR with Act1 as a reference gene for normalization. Mean and standard deviations were calculated from three biological replicates. Asterisks indicate significant differences based on Student’s t‐test (*, P < 0.05; ns, not significant).
