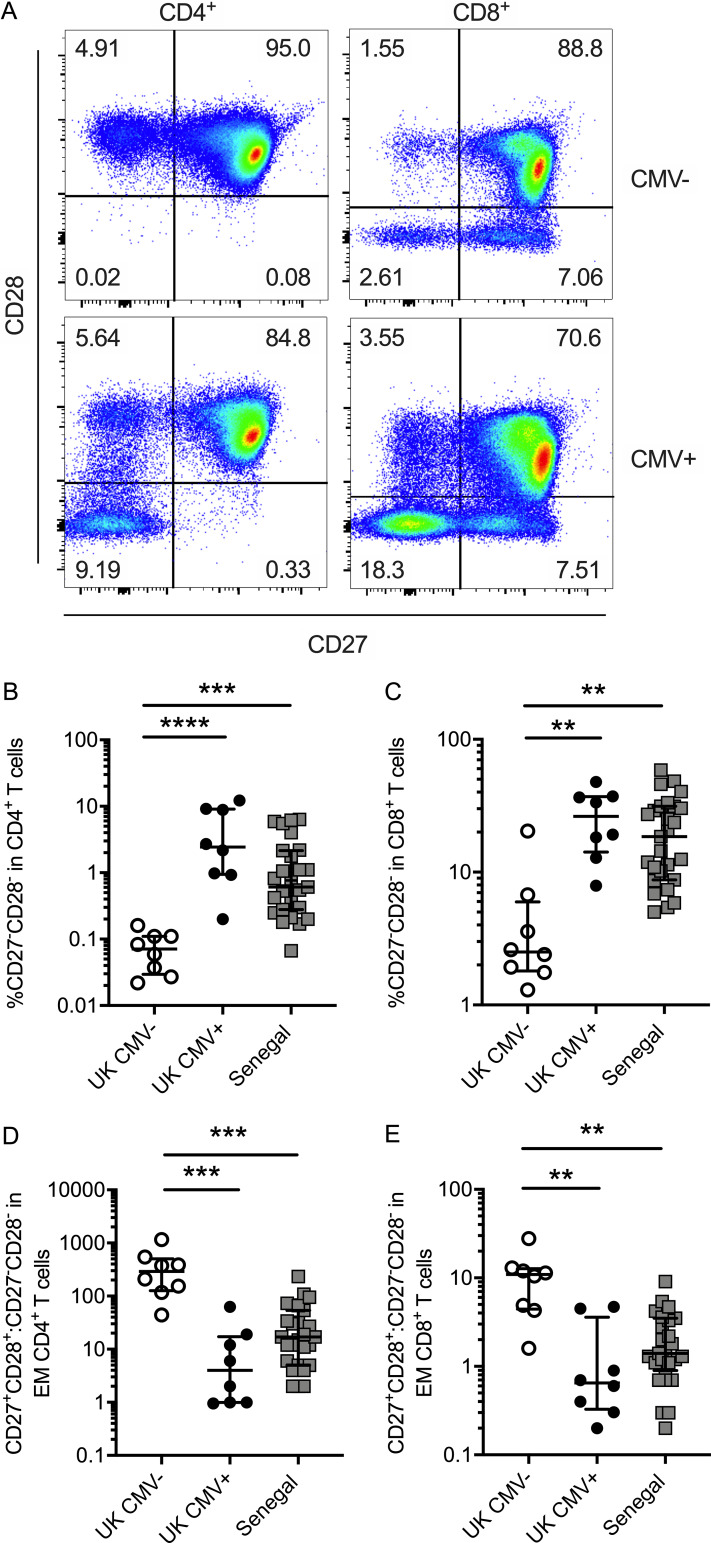
Figure 2.
CD27 and CD28 expression is reduced on T cells from CMV+ young adults. (A) Representative flow plots showing CD27 and CD28 expression on CD4+ (left) and CD8+ (right) T cells in CMV− (top row) and CMV+ (bottom row) individuals. (B) Frequency of CD4+ T cells that are CD27−CD28−. (C) Frequency of CD8+ T cells that are CD27−CD28−. (D and E) Ratio of CD27+CD28+ to CD27−CD28− within effector memory (EM; CD45RA−CCR7−) CD4+ (D) and effector memory CD8+ (E) T cells. UK CMV−, n = 8; UK CMV+, n = 8; Senegal, n = 27. Kruskal–Wallis analyses with Dunn’s post-test across all three groups. **, P < 0.01; ***, P < 0.001; ****, P < 0.0001. Medians shown for all column graphs. Error bars indicate IQRs.

