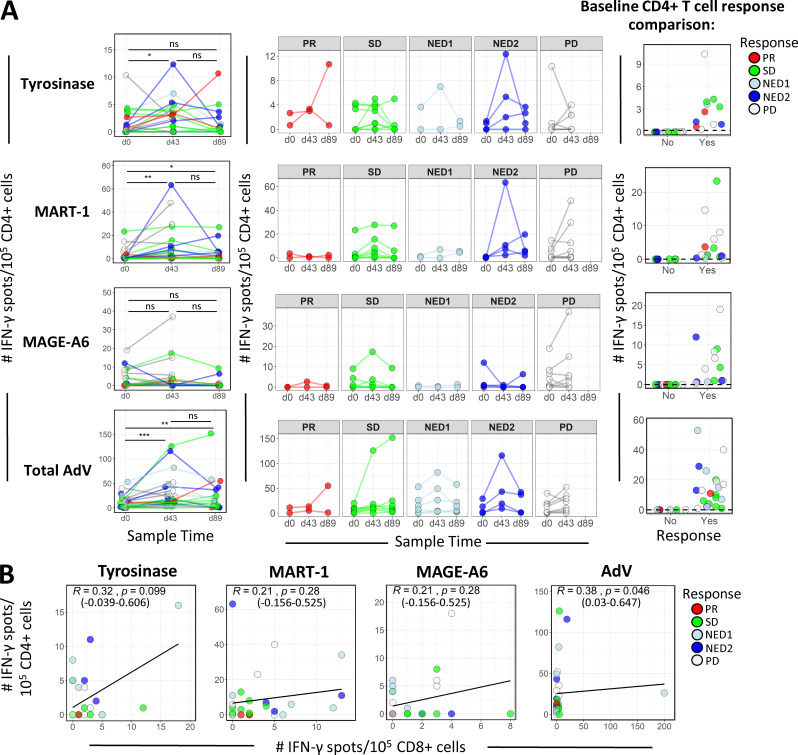
Figure 2.
CD4 T cell IFN-γ ELISPOT frequencies and their correlations with CD8 responses. (A) CD4 cells from patients at d0, d43, and d89 were tested by ELISPOT assay for IFN-γ responses specific against the indicated MAs encoded in the DC vaccine (n = 35). P values for comparisons of frequency distributions between time points were calculated using Wilcoxon signed rank tests. The middle panel shows antigen-specific CD4 IFN-γ ELISPOT counts grouped according to clinical response. Baseline frequency distributions based on the absence (No) or presence (Yes) of positive responses to individual MA antigens are shown in the right panel. Positive responses were detected for 11/24, 15/24, 13/24, and 18/24 patients for tyrosinase, MART-1, MAGE-A6, and total AdV, respectively. *, P ≤ 0.05; **, P ≤ 0.01; ***, P ≤ 0.001. (B) Scatter plots showing correlations between CD4 and CD8 after vaccine (d43); IFN-γ ELISPOT counts reactive to full-length antigens: tyrosinase (equivalence test for R > −0.3 and R < 0.3; P = 0.547), MART-1 (equivalence test for R > −0.3 and R < 0 .3; P = 0.305), MAGE-A6 (equivalence test for R > −0.3 and R < 0.3; P = 0.305), and total AdV (equivalence test for R > −0.3 and R < 0.3; P = 0.215). Spearman correlation coefficient (R), P values based on asymptotic t approximation, and 95% confidence intervals are indicated. ns, not significant.

