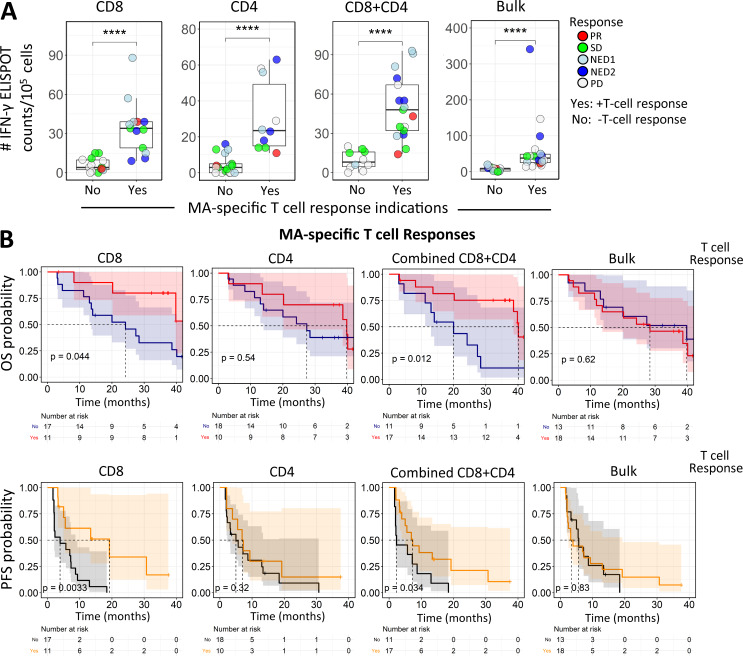
Figure 3.
Combined totals of individual antigen-specific T cell IFN-γ ELISPOT counts correlate with PFS. (A) Summary graphs for CD8, CD4, total (CD8+CD4), and bulk (total PBMCs) IFN-γ ELISPOT counts (net count total for the three shared antigens at d43) with respect to T cell responses, as defined in Materials and methods. Test groups: CD8+ selected T cells responding to either autologous “iDCs” (immature DCs) transduced with a single MA-encoding AdV or (in HLA-A2+ patients) T2 cells pulsed with well-characterized immunodominant peptides; CD4+ selected T cells responding to autologous iDCs transduced with single MA Adv; and bulk (total PBMCs) T cell responses to autologous iDCs transduced with single MA AdV. ****, P ≤ 0.0001. (B) Kaplan-Meier survival analysis of OS and PFS comparing the survival benefits of positive CD8, CD4, combined CD8+CD4, and bulk responses. The log rank test was used to compare the Kaplan-Meier curves.

