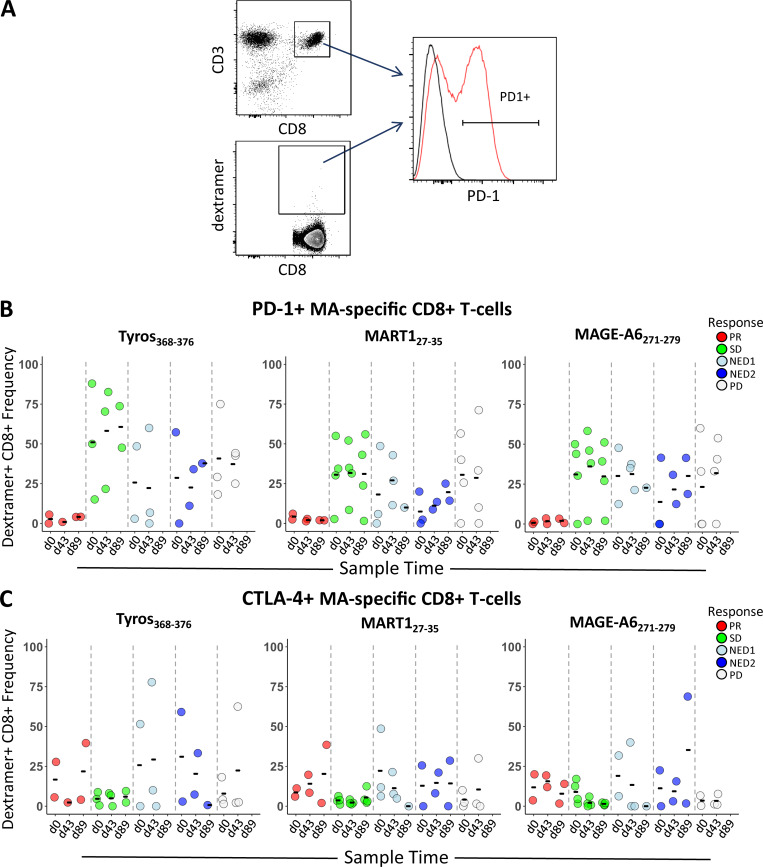
Figure 5.
PD-1 and CTLA-4 expression on CD8 and MA-specific T cells. (A) Gating strategy used to determine dextramer frequencies of PD-1– and CTLA-4–positive MA-specific CD8 T cells from HLA-A2+ patients. (B and C) Shown are distributions of PD-1– (B) and CTLA-4–positive (C) dextramer-specific CD8 T cells from HLA-A2+ patients grouped according to clinical outcome across time points (d0, d43, and d89; n = 16 total; two PR, three SD, three NED1, three NED2, and five PD). Tyros, tyrosinase.

