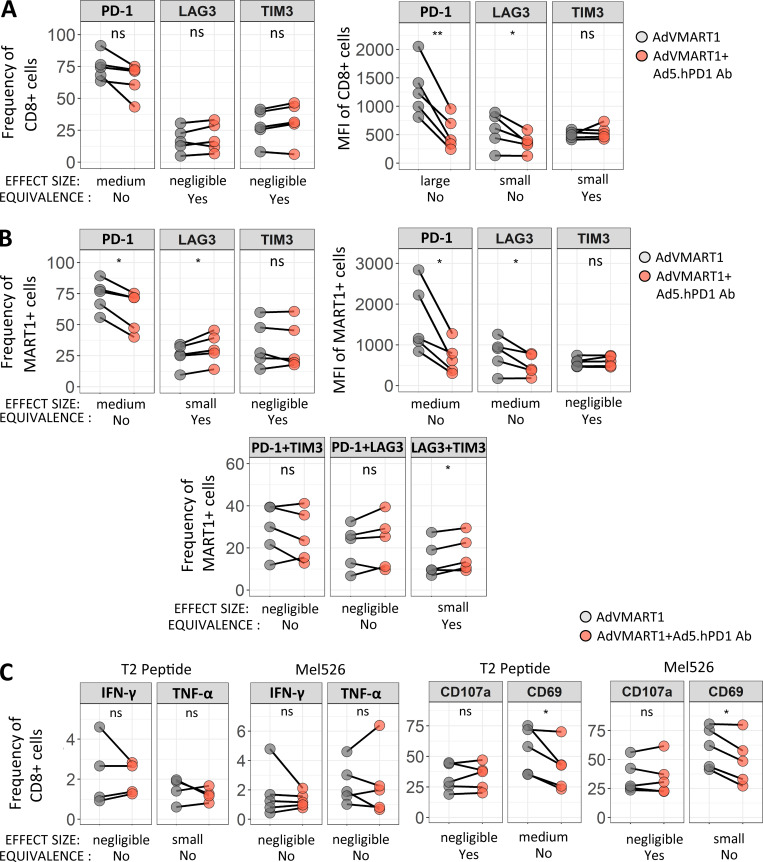
Figure 6.
Effect of stimulating CD8 T cells with DCs transduced with AdVMART1 and Ad5.hPD1Ab in vitro on T cell function. T cells were stimulated with AdVMART1 transduced autologous DCs in vitro followed by restimulation with DCs transduced with AdVMART1 only (gray circles) or in combination with Ad5.hPD1Ab (orange circles). (A and B) Summary graphs showing frequency and mean fluorescence intensity (MFI) of checkpoint molecules CTLA-4, LAG3, PD-1, and TIM3 in CD8 T cells (A) or MART127–35+ CD8 T cells (B). (C) T cells were stimulated with MART127–35+–pulsed T2 or Mel526 and examined for TNF-α, IFN-γ CD107a, and CD69 expression. n = 5; P values shown were calculated using paired t tests. Effect sizes are summarized using Hedges’ g as follows: g < 0.2 (negligible), g < 0.5 (small), g < 0.8 (medium), and g > 0.8 (large). A detailed list of effect sizes, confidence intervals, and equivalence testing results for these data are provided in Table S2. (A–C) *, P ≤ 0.05; **, P ≤ 0.01. ns, not significant.

