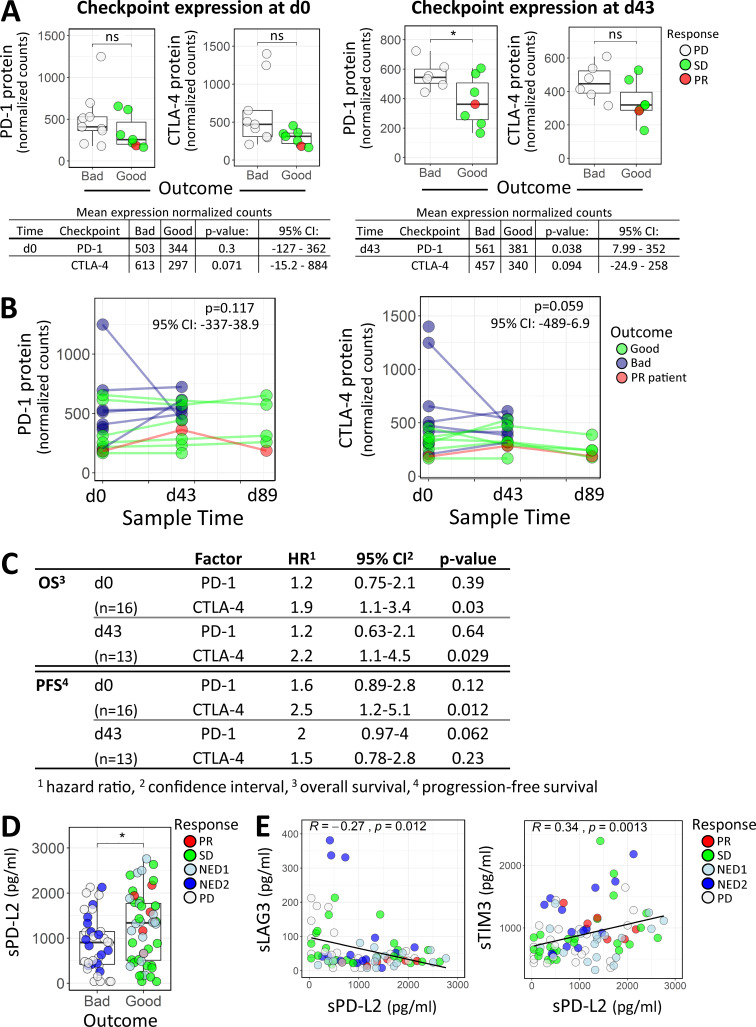
Figure 7.
Immune checkpoint profiling in circulating lymphocytes and patient serum. (A) PD-1 and CTLA-4 protein expression comparisons between outcome groups in baseline (d0) or d43 circulating lymphocytes. The Wilcoxon rank sum test and unpaired Welch’s t test were used for calculating P values at d0 and d43, respectively. *, P ≤ 0.05. (B) A linear mixed effect model was used to evaluate differential PD-1 and CTLA-4 protein expression between outcome groups, accounting for repeated measures of individuals across the three time points (d0, d43, and d89). Statistical significance and 95% confidence intervals (CIs) for the outcome group coefficients are indicated. (C) Univariate Cox regression analysis of PD-1 and CTLA-4 checkpoint protein expression in circulating lymphocytes isolated at baseline (d0) or after vaccine (d43) and their association with OS and PFS. (D) Difference in sPD-L2 expression with respect to good and bad clinical outcome, with P value from Wilcoxon rank sum test. *, P ≤ 0.05. (E) Scatter plots showing correlations between sPD-L2 and sLAG3 (95% CI = −0.457 to −0.06) and sPD-L2 and sTIM3 (95% CI = 0.137–0.516). Spearman correlation coefficient (R) and corresponding P value are indicated on the graphs. ns, not significant.

