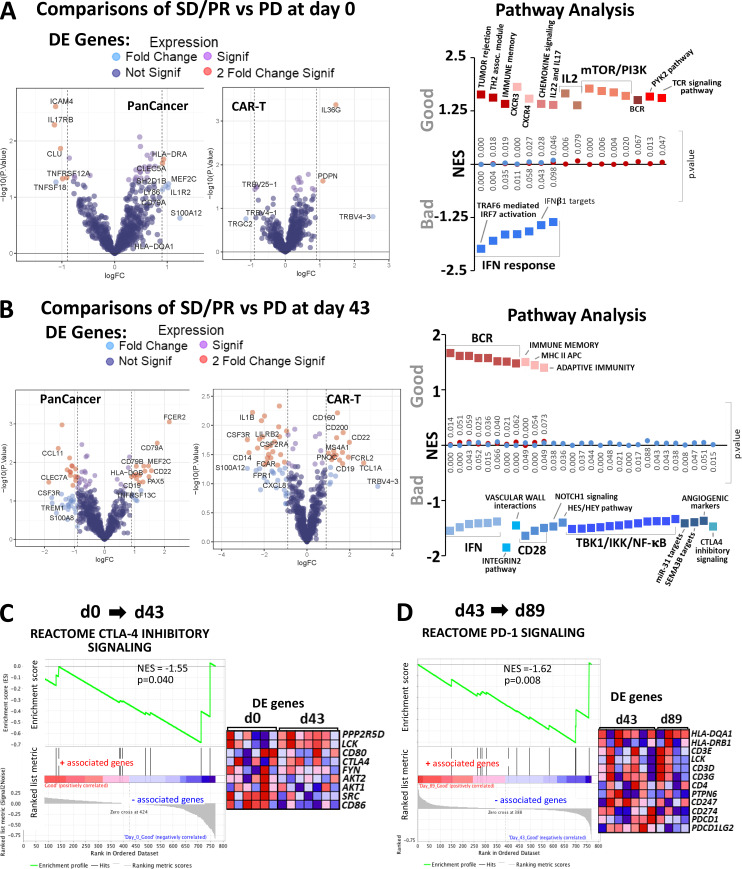
Figure 8.
Differential expression and gene enrichment pathway analysis in circulating lymphocytes. (A and B) Volcano plots show differential gene expression by fold change (logFC) and P value (−log10[p]) for the PanCancer Immune Profiling and CAR-T Characterization NanoString gene panels comparing good (SD/PR) with bad (PD) outcome groups at baseline (d0; A) and d43 (B) in circulating lymphocyte samples. Table S3 lists information about the samples selected for NanoString profiling. Dark blue dots denote nonsignificant genes, purple dots denote significant genes with fold change ≤1.85, light blue dots represent genes with fold change ≥1.85 and P value ≥0.05, and red dots indicate genes with fold change ≥1.85 and P value ≤0.05. Summary of pathways identified by GSEA/MSigDB analysis as showing enrichment among highly differentially expressed genes at d0 (A) and d43 (B). The y axis denotes NES, and the squares represent up-regulated (red, associated with good outcome) and down-regulated (blue, associated with bad outcome) pathways with corresponding gene enrichment P values indicated on the midline. (C) GSEA plot for the CTLA-4 inhibitory pathway and a heatmap of its associated gene set, illustrating enrichment for down-regulation at d43 relative to d0. (D) GSEA plot for the PD-1 signaling pathway and its associated gene set, which is down-regulated at d89 versus d43 in circulating lymphocytes. For C and D, circulating lymphocytes from patients with good clinical outcome were used, as there were no available samples from PD patients. Heatmaps in C and D show the clustered genes in the leading-edge subsets for each pathway category. Gene expression values are represented as colors, where the range of colors (red, pink, light blue, dark blue) shows the range of expression values (high, moderate, low, lowest).

