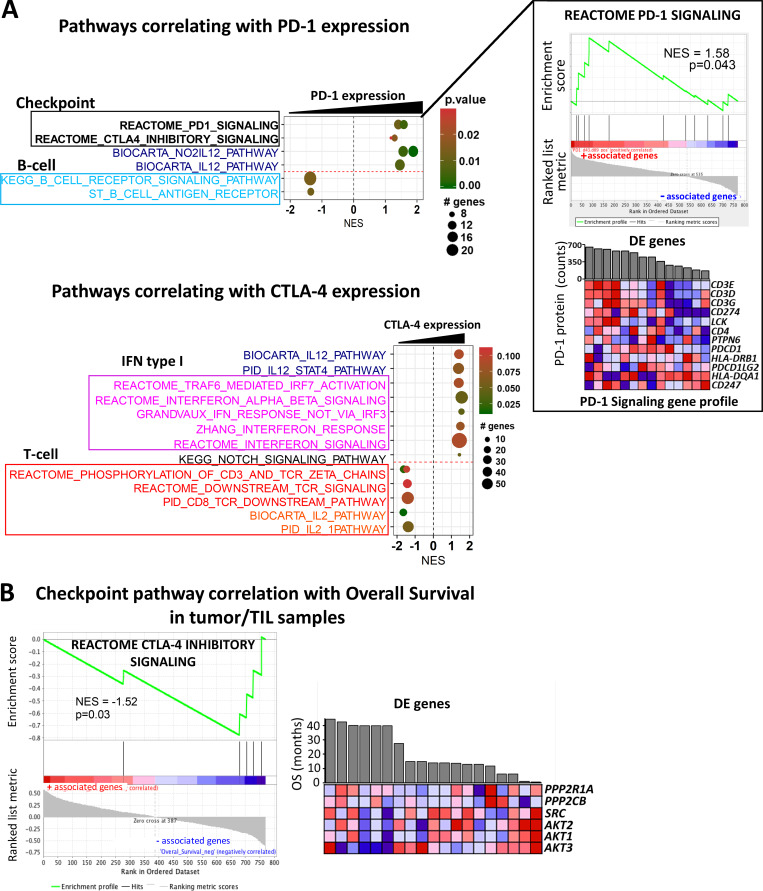
Figure 9.
Significantly enriched pathways associated with immune checkpoint expression levels in circulating lymphocytes and clinical outcome in tumor biopsies. (A) Several GSEA pathways correlating with PD-1 and CTLA4 protein expression are represented. Gene sets belonging to different pathway categories are represented as dots, which are organized by their NES score along the x axis. The color and size of the dots indicate the corresponding P values and number of genes associated with the gene set, respectively. Representative GSEA plot and heatmap for genes involved in the PD-1 signaling pathway, which positively correlates with PD-1 protein expression (shown as bar graph above the heatmap) in patient lymphocytes. (B) GSEA plot and clustered heatmap of expression values for leading edge genes in the CTLA-4 inhibitory signaling pathway, which negatively correlates with OS in tumor biopsy samples (n = 19). Refer to Fig. 7 for interpretation of the gene expression values in heatmaps.

