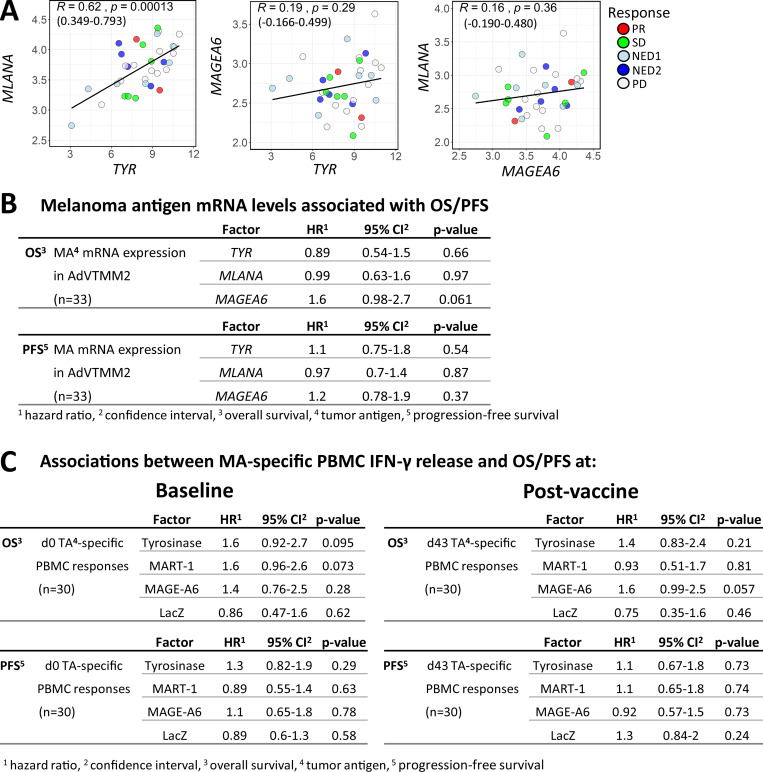
Figure S1.
Associations of MA expression levels in the DC vaccines with survival time and clinical responses. (A) Scatter plots showing correlations between TYR (Tyrosinase) and MLANA (MART-1; in the same expression cassette), TYR and MAGEA6 (MAGE-A6; separate cassettes; equivalence test for R > −0.3 and R < 0.3; P = 0.258) and MLANA and MAGEA6 (separate cassettes; equivalence test for R > −0.3 and R < 0.3; P = 0.215) based on mRNA expression measured in the DC vaccines. Pearson correlation coefficient (R), with P values and 95% confidence intervals indicated. (B) Univariate Cox regression analyses for DC vaccine–MA antigen expression levels and OS and PFS. (C) Univariate Cox regression analysis for associations between MA-specific IFN-γ release (ELISPOT counts) from total PBMCs isolated at baseline (d0) or after vaccine (d43) and OS and PFS.

