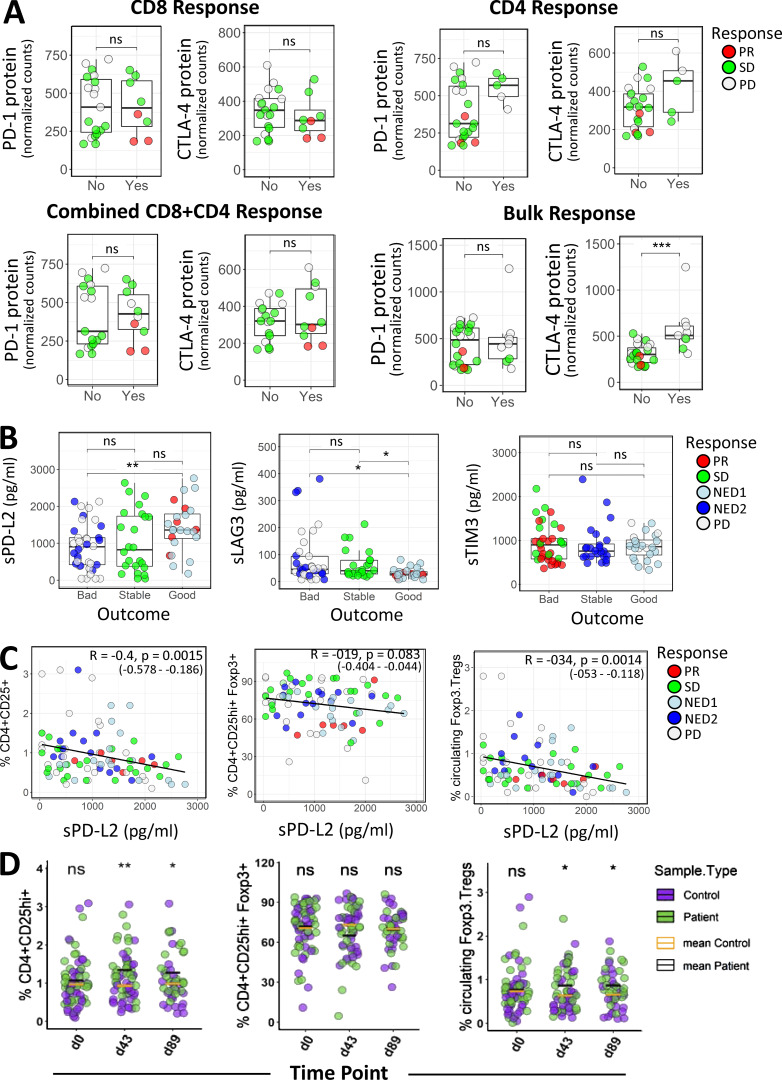
Figure S3.
Immune checkpoint profiling in circulating lymphocytes and Luminex immune checkpoint profiling in serum. (A) Distributions of checkpoint PD-1 and CTLA-4 protein expression in relation to patient-derived MA-specific CD8, CD4, combined CD8+CD4, and Bulk (Total PBMCs) IFN-γ T cell responses, as defined in Materials and methods. (B) The Human Checkpoint 14-plex assay kit (Procarta Plex) was used to measure serum proteins, including checkpoint, costimulatory, and exhaustion markers in 35 patients profiled at baseline (n = 35), d43 (n = 30), and d89 (n = 20). Shown are distributions of soluble cytokine sPD-L2, sLAG3, and sTIM3 levels across the clinical outcome groups. For A and B, the Wilcoxon rank sum test was used for calculating P values. *, P ≤ 0.05; **, P ≤ 0.01; ***, P ≤ 0.001. (C) Scatter plots showing correlations between FACS T reg cell profiles and sPD-L2 levels. Spearman correlation coefficient (R), P values, and 95% confidence intervals are indicated. (D) Percentage distributions of FACS T reg cells in melanoma patient and normal donor samples. P values denoting significance between patient and healthy samples at indicated time points were calculated using the unpaired Welch’s t test. *, P ≤ 0.05; **, P ≤ 0.01. ns, not significant.

