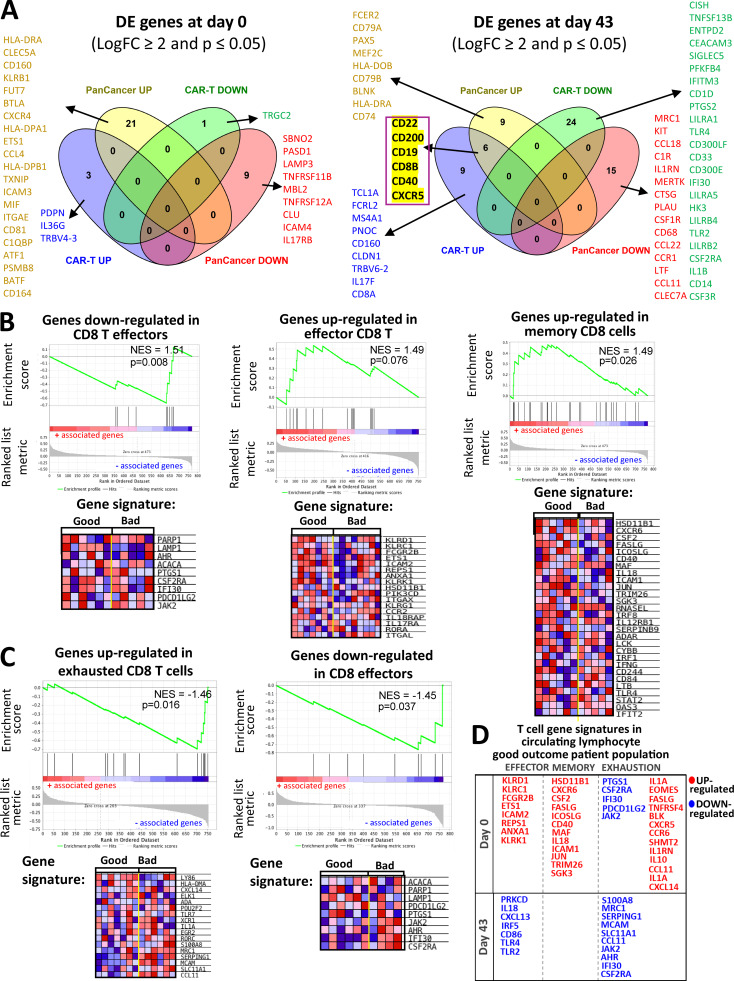
Figure S5.
Comparisons for differentially expressed genes between the NanoString Panels and GSEA analysis of T cell exhaustion gene profiles. (A) Summary of differentially expressed (DE) genes in circulating lymphocytes at d0 and d43. Venn diagrams show differentially expressed genes (LogFC ≥ 2 and P ≤ 0.05) in baseline (left) and d43 lymphocyte samples (right) that are represented in both the PanCancer Immune Profiling and CAR-T Characterization NanoString gene panels used in our study. PanCancer UP/DOWN and CAR-T UP/DOWN groups contain genes that are up-/down-regulated in the PanCancer Immune Profiling and CAR-T Characterization NanoString panel, respectively. Genes from each of the Venn diagram sections are listed in the figure. A set of six genes that are highlighted in yellow denote gene probes that were detected as up-regulated in both NanoString panels. (B and C) Immune checkpoint pathway associations with T cell exhaustion profiles in circulating lymphocytes. Representative GSEA plots for T cell exhaustion-related immune regulatory pathways correlating with good and bad clinical outcome groups in baseline (B) and d43 (C) circulating lymphocytes. T cell exhaustion signatures were obtained using the MSigDB C7 immunological gene database. Heatmaps next to the GSEA plots show clustered genes in the leading-edge subsets for each pathway category. Gene expression values are represented as colors, where the range of colors (red, pink, light blue, dark blue) shows the range of expression values (high, moderate, low, lowest). (D) Effector/memory T cellsversus exhaustion gene signatures in the good outcome patients’ circulating lymphocytes. Here, we provide a table summary for a set of differentially expressed genes at baseline (d0) and in postvaccine samples (43) that are categorized based on their association with a particular T cell phenotype (effector, memory, or exhaustion).

