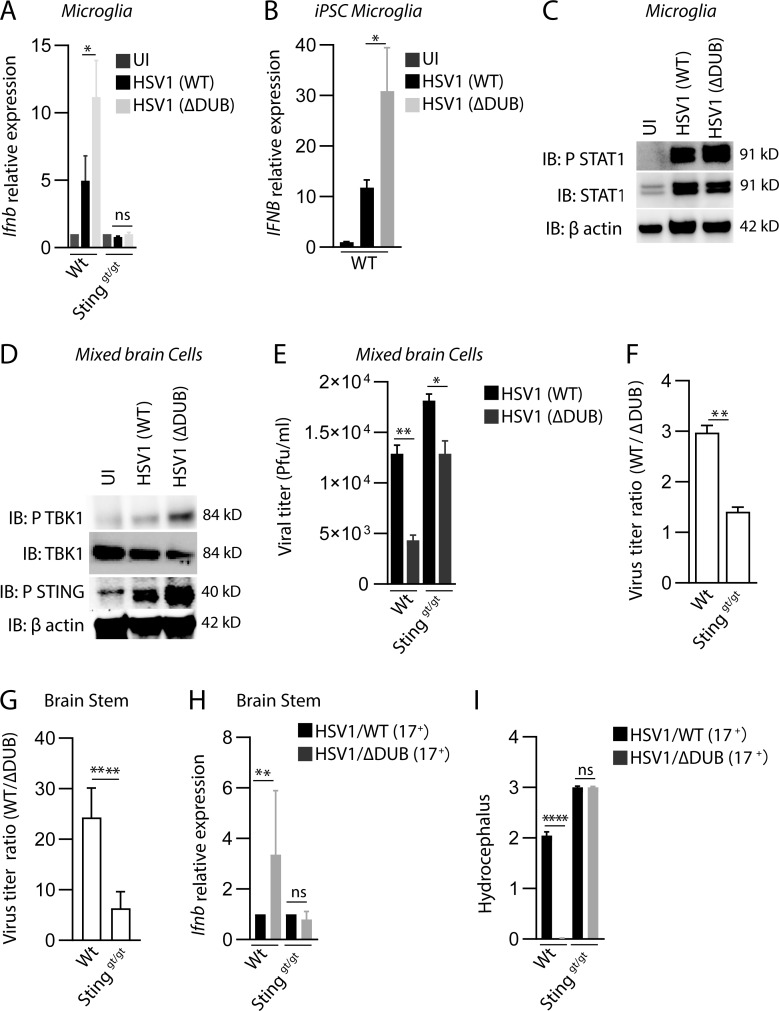
Figure 3.
The HSV1 VP1-2 DUB targets the cGAS–STING pathway in microglia. (A) WT and Stinggt/gt primary microglia were isolated, cultured, and infected with HSV1 (WT) or HSV1 ΔDUB virus (KOS strain, MOI 3) for 8 h. Total RNA as isolated and levels of Ifnb were measured by quantitative RT-PCR. The Ifnb mRNA levels were normalized to β-actin and shown relative levels compared with uninfected controls (n = 3). (B) iPSC-derived microglia were infected with HSV1 (WT) or HSV1 ΔDUB virus as above. IFNB mRNA levels were normalized to β-actin and are shown as relative levels compared with uninfected controls (n = 3). (C) WTmicroglia cultures were infected with HSV1 (WT) or HSV1 ΔDUB (KOS strain, MOI 3) for 8 h. Cell lysates were immunoblotted with the indicated antibodies. (D) Cultured mixed primary brain cells were infected with HSV1 (WT) or HSV1 ΔDUB (KOS strain) at MOI 3 for 16 h. Total cell lysates were cleared and immunoblotted with the indicated antibodies. (E) WT and Stinggt/gt mixed primary brain cell cultures were infected with HSV1 (WT) or HSV1 ΔDUB (KOS strain, MOI 10) for 24 h. Supernatants were collected, and the virus yield was quantified by plaque assay (n = 3). (F) Viral yield ratios between HSV1 (WT) and HSV1 ΔDUB in mixed brain cells from WT and Stinggt/gt mice. (G–I) C57BL/6 WT and Stinggt/gt mice were infected in the cornea with HSV1/WT or HSV1 ΔDUB (17+ strain) as described in Materials and methods. Viral load and Ifnb mRNA levels in the brain stem were quantified on day 5 after infection. Viral load is presented as ratios between WT and ΔDUB virus in the two mouse strains. (I) Degree of hydrocephalus was scored in the infected mice on day 5 after infection (n = 5). P values were calculated using a two-tailed unpaired Student’s t test. *, P < 0.05; **, P < 0.01; ****, P < 0.0001; ns, not significant. Error bars represent standard deviation.

