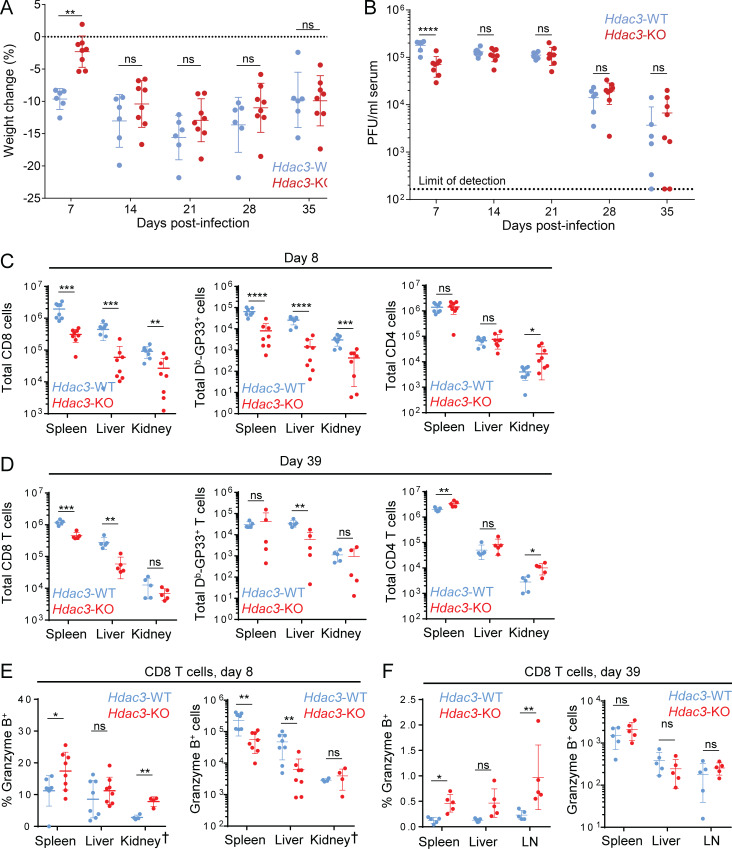
Figure 4.
Analysis of Hdac3-deficient CD8 T cells in a model of chronic viral infection. TCR-polyclonal Hdac3-KO mice and Hdac3-WT littermates were infected with 2 × 10⁶ PFU LCMV Clone 13 by intravenous injection. (A and B) Weight change (A) and viral load in sera (B) of infected Hdac3-KO (n = 8) and Hdac3-WT (n = 6) mice. Data are representative of two independent experiments with six to eight mice of each genotype. (C and D) Analysis of T cell numbers on day 8 (C) and day 39 (D) in indicated organs as measured by flow cytometry. (E and F) Analysis of the Granzyme B response in CD8 T cells in indicated organs on day 8 (E) and day 39 (F) as measured by flow cytometry, showing both percentage (left) and number (right) of Granzyme B+ CD8 T cells. Data are pooled from two independent experiments (C and E) or from one experiment (D and F), each with four mice per genotype except for kidney data marked †, which is from one experiment with four mice per genotype. Means ± SEM (A) or means ± SD are indicated (B–F). P values were calculated by two-way ANOVA (A and B) or two-tailed Student’s t test (C–H). *, P < 0.05, **, P < 0.01, ***, P < 0.001, ****, P < 0.0001.

