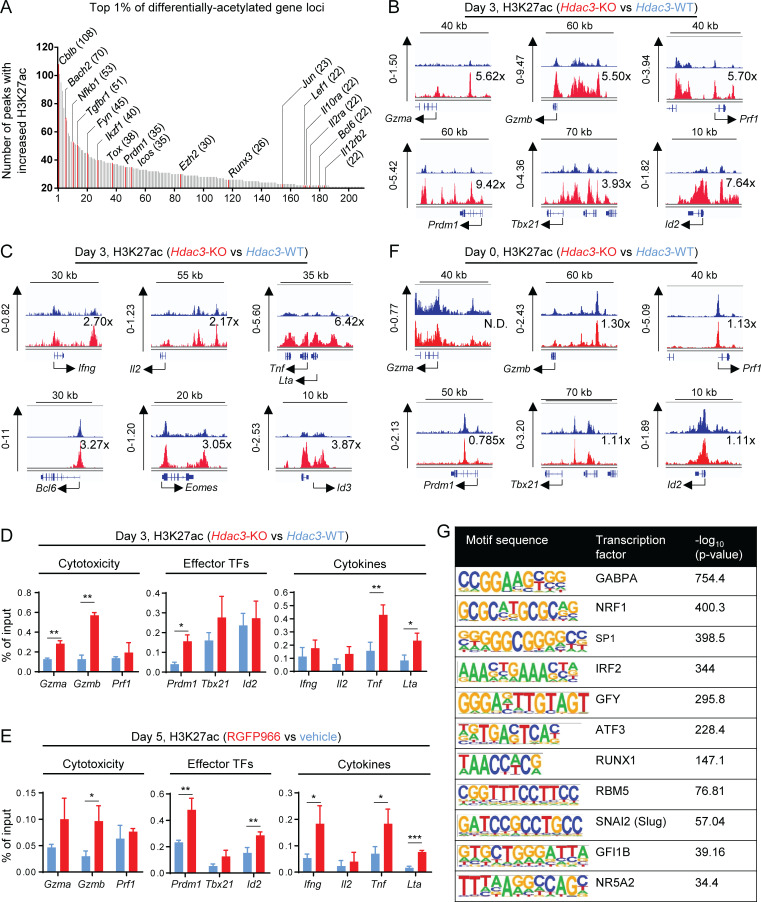
Figure 6.
HDAC3 deacetylates H3K27ac epigenetic marks at gene loci associated with cytotoxic effector function in activated CD8 T cells. (A–C) Hdac3-KO and Hdac3-WT OT-I T cells were co-cultured with irradiated OVA peptide–pulsed BMDCs in vitro for 3 d and sorted to purity. Total chromatin was prepared from fixed cell pellets for immunoprecipitation with antibodies specific to H3K27ac for ChIP-seq analysis. (A) Top 1% of differentially acetylated gene loci in activated Hdac3-KO CD8 T cells with at least 21 differentially acetylated H3K27ac peaks per locus. Genes with described regulatory roles in T cell activation, effector function, or differentiation are highlighted in red and labeled. The number of differentially acetylated H3K27ac peaks mapping to each highlighted gene is indicated in parentheses. (B) H3K27ac ChIP-seq tracks of H3K27ac showing representative genes encoding cytotoxicity genes (top row) or transcription factors polarizing toward an effector phenotype in CD8 T cells (bottom row). Relative increases in H3K27ac signal in Hdac3-KO relative to Hdac3-WT cells for each genomic locus shown are indicated. (C) H3K27ac ChIP-seq tracks of H3K27ac showing representative genes encoding CD8 effector cytokines (top row) or transcription factors polarizing toward a memory phenotype in CD8 T cells (bottom row). Relative increases in H3K27ac signal in Hdac3-KO relative to Hdac3-WT cells for each genomic locus shown are indicated. (D and E) OT-I T cells were co-cultured with irradiated OVA peptide–pulsed BMDCs in vitro for indicated times and sorted to purity. Total chromatin was prepared from fixed cell pellets for immunoprecipitation with antibodies specific to H3K27ac for ChIP-qPCR analysis. Data are representative of two independent experiments each with three or four technical replicates per qPCR reaction. (D) Comparison of H3K27ac at promoters of indicated genes in Hdac3-KO and Hdac3-WT CD8 T cells activated for 3 d in vitro. (E) Comparison of H3K27ac at promoters of indicated genes in RGFP966- and vehicle-treated CD8 T cells activated for 5 d in vitro. (F) H3K27ac ChIP-seq tracks of H3K27ac showing representative genes encoding cytotoxicity genes (top row) or transcription factors polarizing toward an effector phenotype in CD8 T cells (bottom row) in naive Hdac3-KO and Hdac3-WT CD8 T cells. Relative increase in H3K27ac signal in Hdac3-KO relative to Hdac3-WT cells is indicated for each genomic locus. (G) Transcription factor binding motifs enriched in genomic regions with increased H3K27ac in activated Hdac3-KO CD8 T cells as in A–C. Genomic regions containing H3K27ac peaks with increased signal in Hdac3-KO T cells relative to Hdac3-WT cells were analyzed for mammalian (Homo sapiens and Mus musculus) transcription factor binding motifs using the HOMER motif analysis algorithm (Heinz et al., 2010). Means ± SD are indicated (D and E). P values were calculated by two-tailed Student’s t test (D and E). *, P < 0.05, **, P < 0.01, ***, P < 0.001. Statistical analysis for H3K27ac ChIP-seq data are described in the Materials and methods section. H3K27ac ChIP-seq data are available through GEO accession no. GSE143644.

