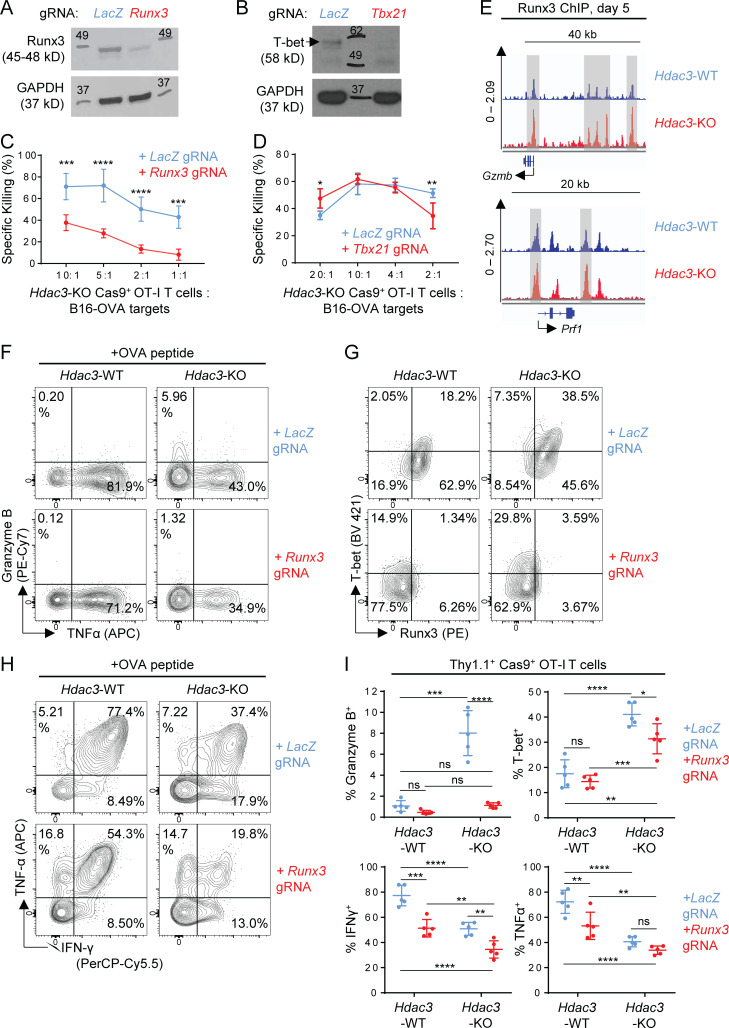
Figure 8.
Runx3 but not Tbx21 is required for the augmented cytotoxic phenotype of Hdac3-KO T cells. (A and B) Validation of lentiviral gRNA vectors targeting Runx3 (A) and Tbx21 (B) in Cas9+ OT-I T cells. Whole cell lysates from 2 × 10⁵ magnetically purified transduced T cells were loaded per lane for immunoblot analysis. A LacZ-targeting gRNA vector was used as a negative control for Runx3 or Tbx21 editing. Molecular weights (kD) are indicated on immunoblot images. Where multiple bands are present, a black arrow indicates a band of the correct molecular weight. (C and D) Comparison of in vitro cytotoxicity of Hdac3-KO and Runx3-Hdac3–double KO (C) or Hdac3-KO and Tbx21-Hdac3–double KO (D) CD8 T cells. Hdac3-KO Cas9+ OT-I T cells were transduced with indicated gRNA sequences, activated in vitro with irradiated OVA peptide–pulsed BMDCs, and evaluated for cytotoxicity against B16-OVA targets. Data are from one experiment each, with four replicates per condition. (E) Runx3 ChIP-seq tracks of genes coding for representative cytotoxic mediators for in vitro activated OT-I T cells. Hdac3-KO and Hdac3-WT OT-I T cells were co-cultured with irradiated OVA peptide–pulsed BMDCs and sorted to purity after 5 d for chromatin preparation and ChIP-seq. Specific peaks with increased Runx3 binding in Hdac3-KO relative to Hdac3-WT CD8 T cells are highlighted with gray columns. Runx3 ChIP-seq data are available through GEO accession no. GSE143644. (F–I) Hdac3-KO and Hdac3-WT Cas9+ OT-I T cells were transduced with lentiviral vectors expressing Runx3- or LacZ-targeting gRNA sequences, magnetically purified for Thy1.1+ expression, and adoptively transferred into Thy1.2+ C57BL/6 recipients. Mice were immunized subcutaneously with OVA + poly(I:C) in PBS. OT-I T cells in inguinal LNs draining immunization site were analyzed after 4 d. Flow-cytometric analysis of Granzyme B (F), T-bet (G), and effector cytokine (H) expression in transferred OT-I T cells in inguinal LNs. Quantification of flow-cytometric data are shown in I. Data are representative of two independent experiments with five mice per treatment group. Means ± SD are indicated (C, D, and I). P values were calculated by two-way ANOVA (C, D, and I). *, P < 0.05, **, P < 0.01, ***, P < 0.001, ****, P < 0.0001.

