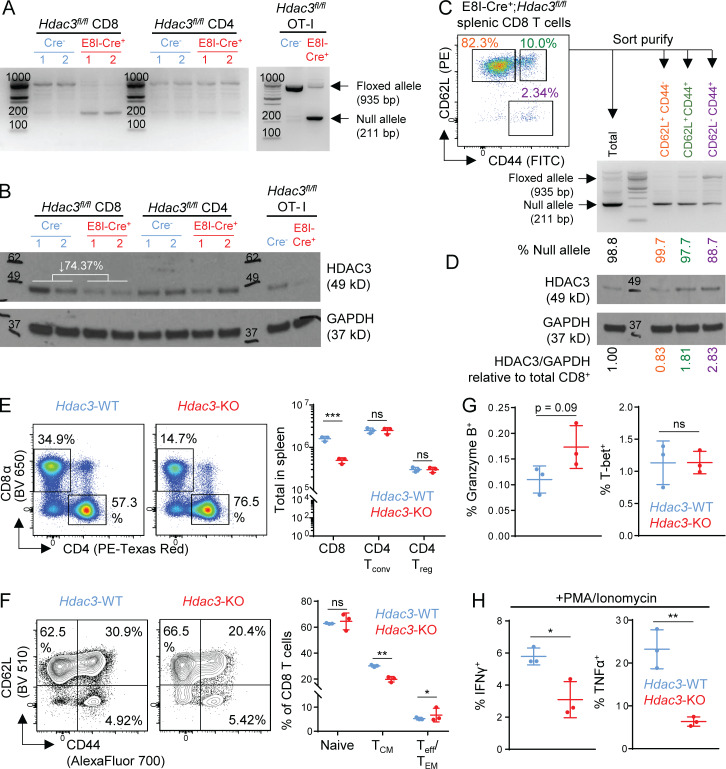
Figure S3.
Characterization of peripheral T cells in E8I-Cre+; Hdac3fl/flHdac3-KO mice. Related to Fig. 1. (A and B) Evaluation of on-target KO efficiency of Hdac3 in E8I-Cre+; Hdac3fl/fl mice. Total CD8 and CD4 T cells were sorted from 6-wk-old TCR-polyclonal E8I-Cre+;Hdac3fl/fl and Cre− Hdac3fl/fl littermates (three mice each) for assessment of KO efficiency by PCR (A) and immunoblot (B) analysis. A parallel analysis was performed for magnetically purified OT-I transgenic E8I-Cre+; Hdac3fl/fl and Cre−; Hdac3fl/fl T cells. 50 ng of purified genomic DNA was loaded as a template for PCR. Whole cell lysates prepared from 5 × 10⁵ cells were loaded for immunoblotting. Molecular weights in basepairs or kilodaltons are indicated on PCR gel and immunoblot images, respectively. The mean percentage reduction in band intensity for HDAC3 in Hdac3-KO relative to Hdac3-WT CD8 T cells is indicated on the Western blot image. (C and D) Evaluation of Cre-mediated loss of Hdac3 in subpopulations of peripheral CD8 T cells in E8I-Cre+; Hdac3fl/fl mice. Sort-purified total, CD62L+ CD44− naive, CD62L+ CD44+ TCM, and CD62L− CD44+ Teff/EM CD8 T cells pooled from 3 E8I-Cre+; Hdac3fl/fl mice were analyzed by PCR (C) and immunoblot (D) as in A and B, respectively. (E) Cell numbers of splenic T cell compartments in 10-wk-old TCR-polyclonal E8I-Cre+ and Cre− Hdac3fl/fl littermates. CD4 Tconv, conventional CD4+ FoxP3− T cells; CD4+ Treg, CD4+ FoxP3+ regulatory T cells. Data are from one experiment with three mice per genotype. (F) Flow-cytometric characterization of surface marker phenotypes of splenic CD8 T cells in Hdac3-KO and Hdac3-WT mice gated as in E. Naive, CD62Lhi CD44lo cells; TCM, CD62Lhi CD44hi central memory cells; Teff/TEM, CD62Llo CD44hi effector or effector memory cells. Data are from one experiment with three mice per genotype. (G and H) Analysis of markers of CD8 effector function in splenic CD8 T cells in Hdac3-KO and Hdac3-WT mice gated as in E. Data are from one experiment with three mice per genotype (E–H). Means ± SD are indicated (E–H). P values were calculated by two-tailed Student’s t test. *, P < 0.05, **, P < 0.01, ***, P < 0.001.

